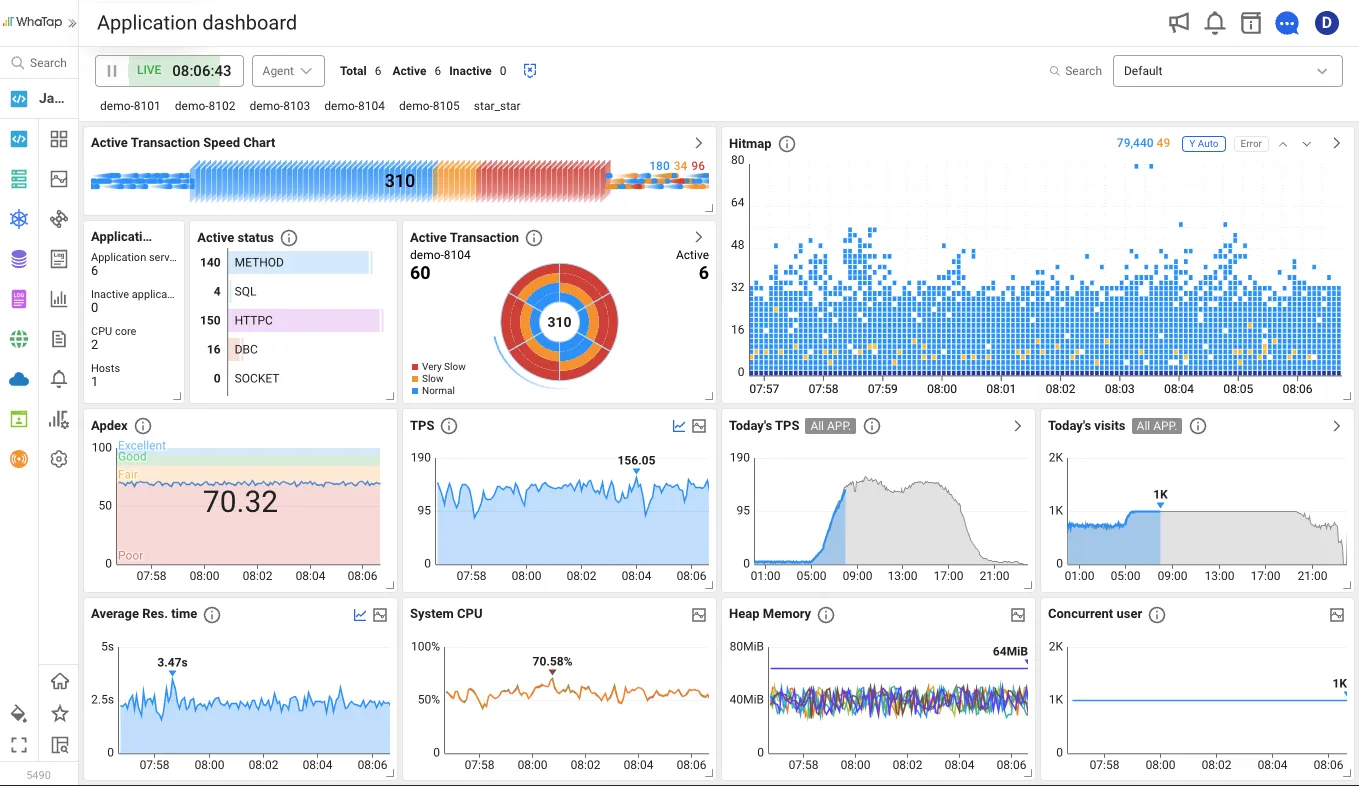
Transaction performance Deep Dive
You can trace not only SQLs and HTTP calls but also the method level. With WhaTap's unique “Active Stack” feature, you can analyze the method level without cumbersome profile settings.
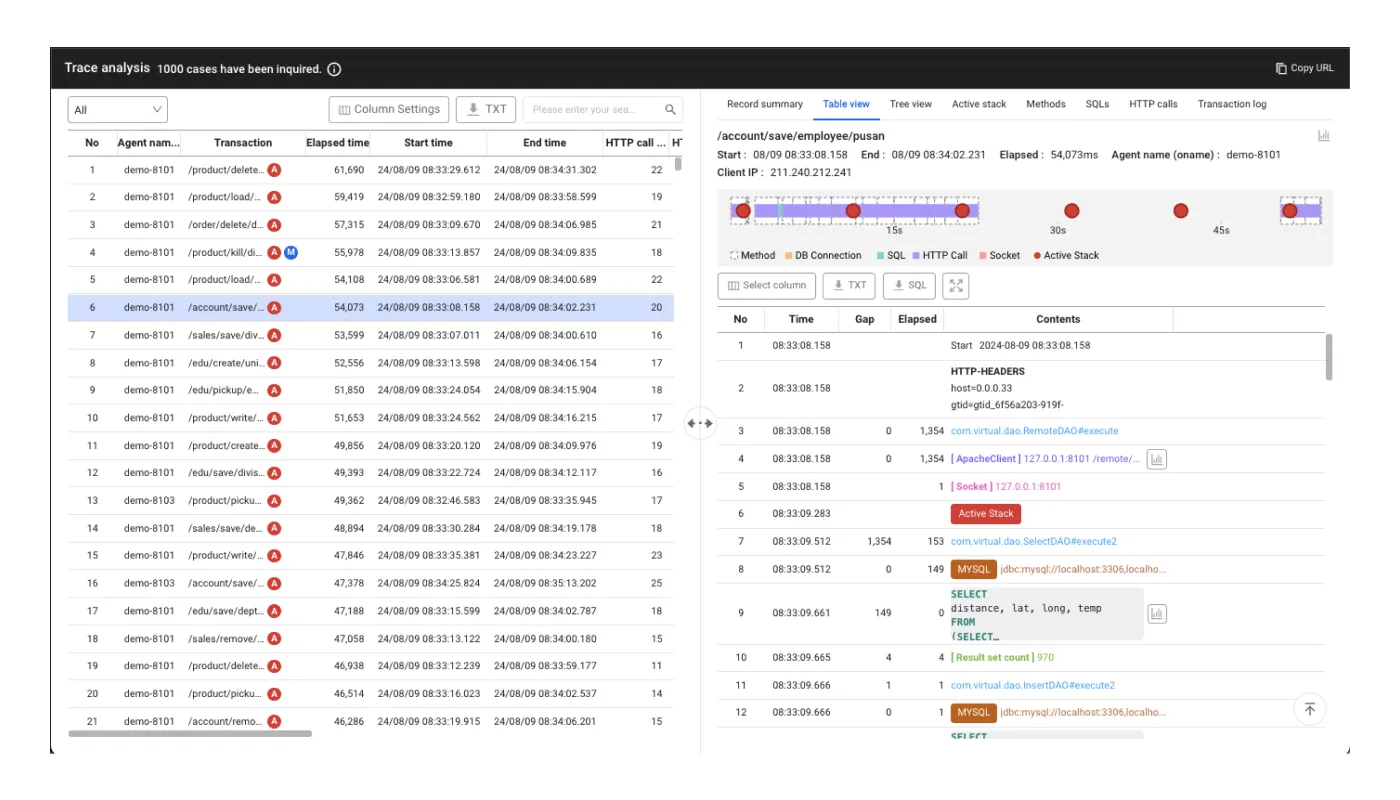
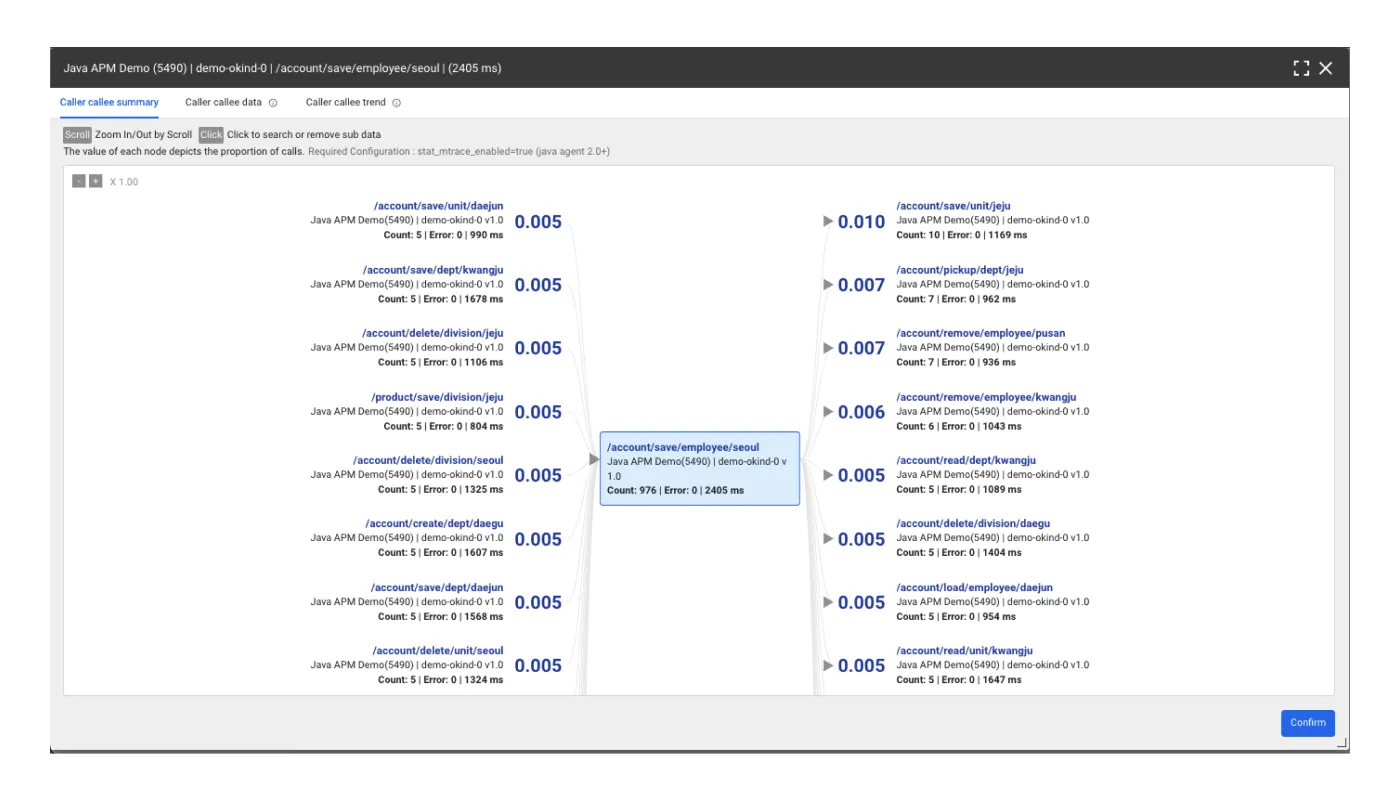
Analysis of the multi-project transaction linkage
It provides the integrated trace analysis feature that allows you to easily understand the transactions with complex call relationships.
Tracing and log-integrated analysis
You can check both the detailed profile of a transaction and the logs left while performing transactions at the same time, making it easier to identify problems.
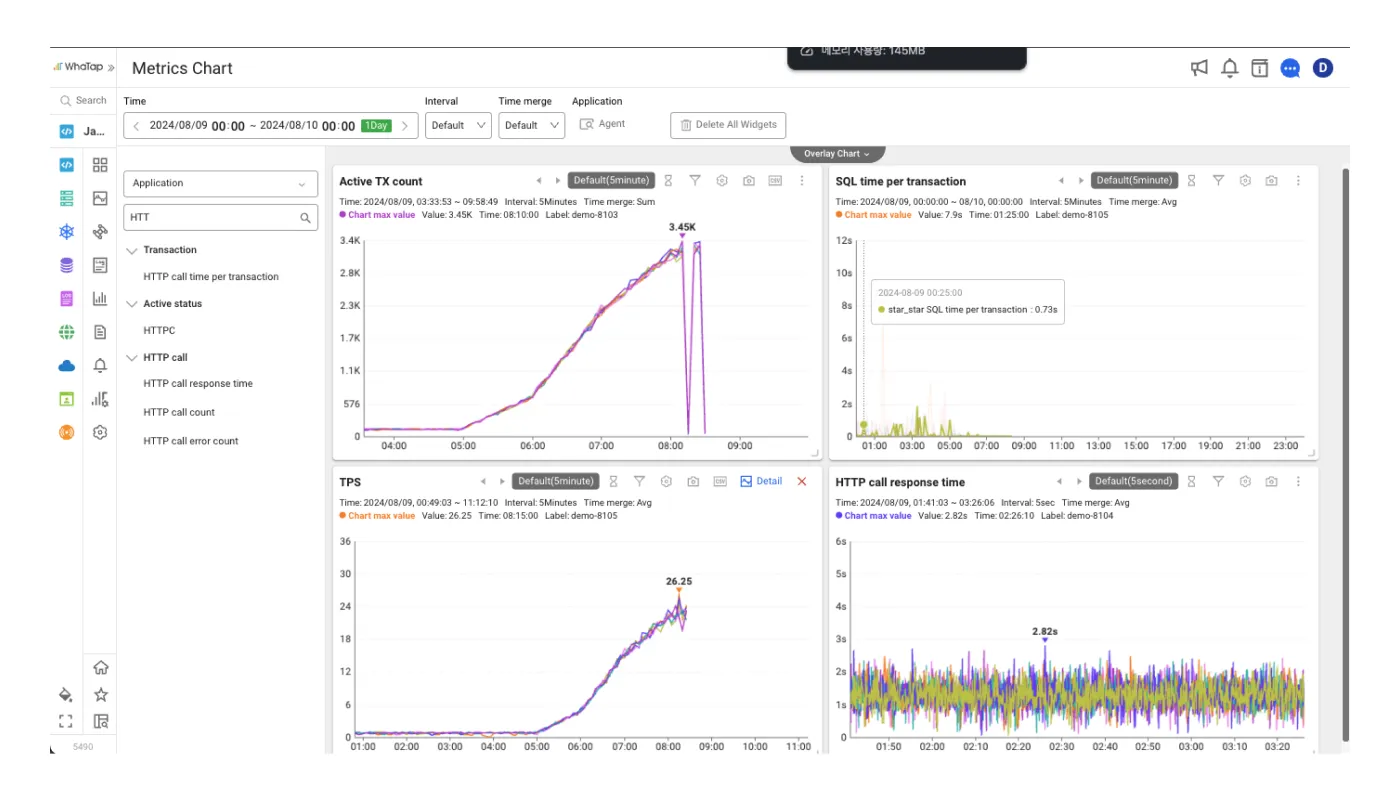
Post analysis (Cube)
You can check various metrics at a time based on the time axis. Because it is possible to check the specific time zone where the response time, error count, or throughput is high, you can identify problematic factors in the same time zone or accurately view the service status.
Analysis of the AI-based response distribution pattern
It automatically detects specific patterns and generates the corresponding alerts. It also quickly notify you of issues that the administrator has not been aware of.
Asynchronous transaction profile
WhaTap's unique BCI (Byte Code Instrumentation) technology effectively traces the performance of asynchronous transactions. You can see the transaction profiles for applications that are using WebFlux, Reactor, Hystrix, and the like.
.svg)
.webp)
.webp)


.webp)
.webp)
.webp)
.webp)
.webp)
.webp)
.webp)
.webp)

%201.svg)
.svg)


