Kubernetes Monitoring
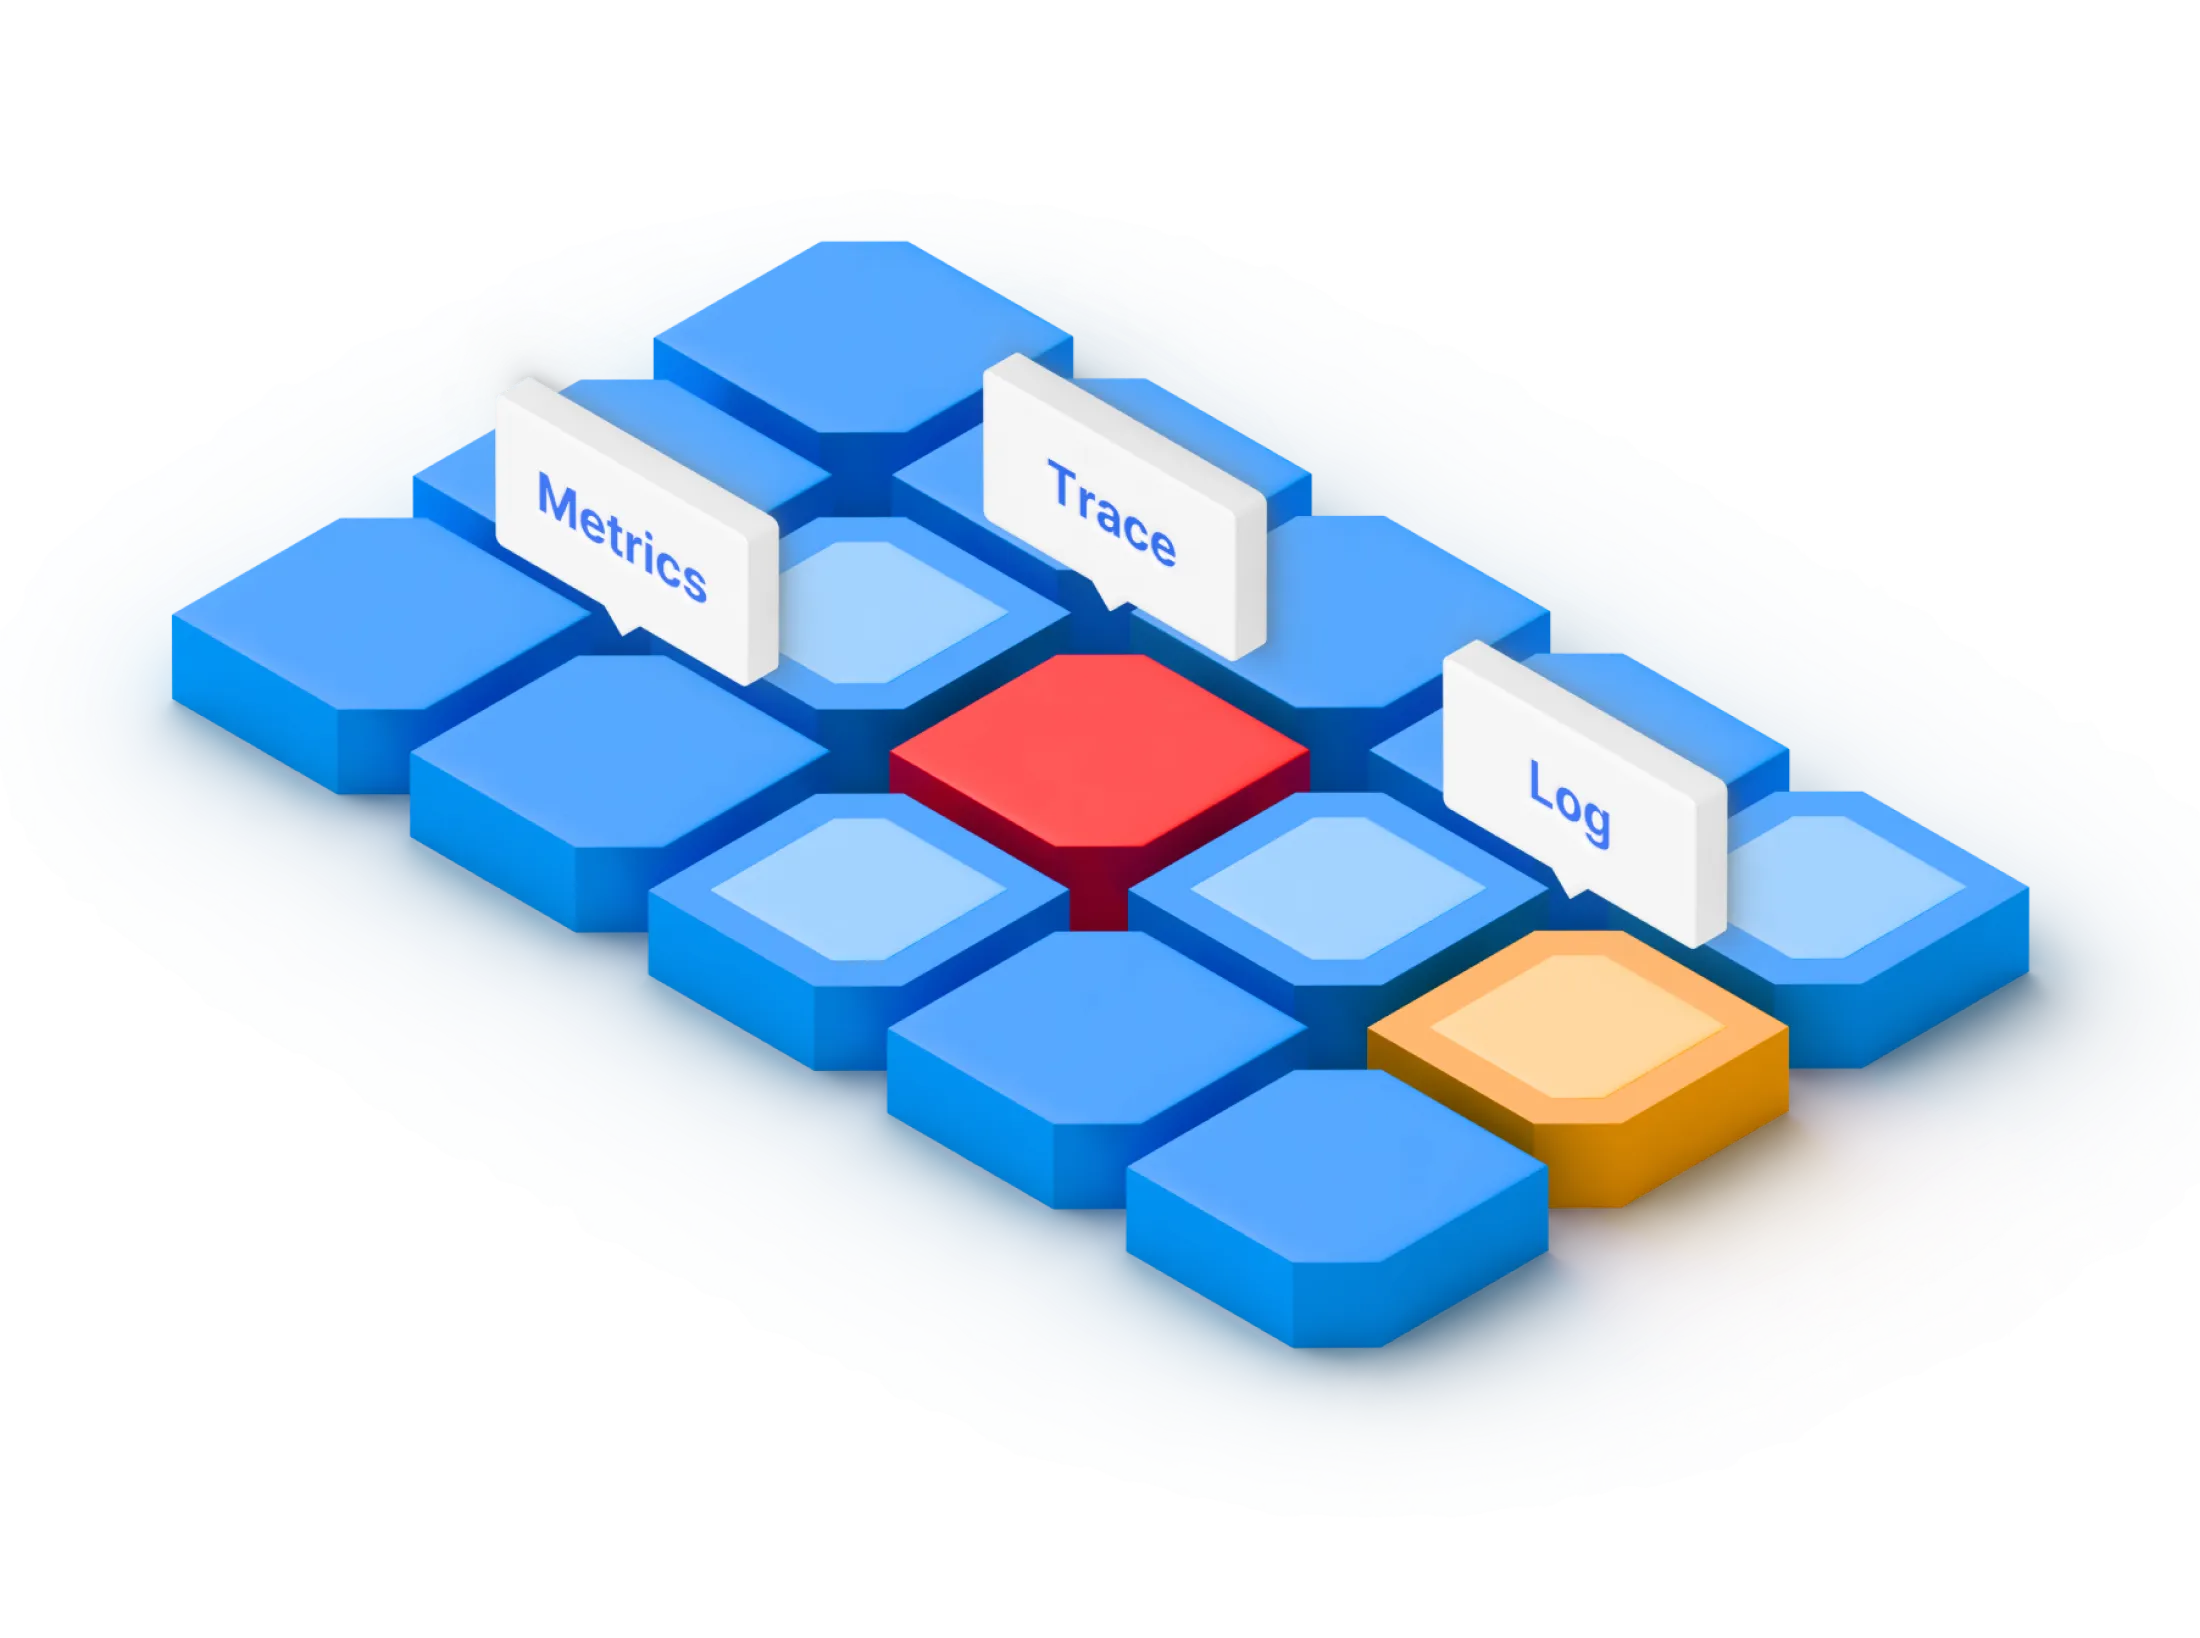
Seamless integration between Kubernetes and applications can pinpoint problematic
objects by using metrics, traces, logs, and events.
objects by using metrics, traces, logs, and events.
Kubernetes Insight
Unique features of WhaTap Kubernetes

Monitoring the entire Kubernetes area
You can monitor the entire area of Kubernetes, from control planes to applications.

Real-time monitoring in a large-scale cluster environment
Hundreds of nodes can be monitored in seconds without any increased load.

Grouping containers by user perspective
On one screen, resource grouping can ensure visibility from multiple perspectives.

Container, application, and log correlation analysis
It provides an integrated visibility into container-based microservices through metrics, traces, and log correlation analysis.

Cost savings through the license policy
You can monitor Kubernetes at a reasonable cost compared to other companies.

Certified Kubernetes technology
WhaTap Labs obtained certifications from Cloud Native Computing Foundation (CNCF), Kubernetes Certified Service Provider (KCSP), and Cloud Service Security Certification (CSAP).
Container Map
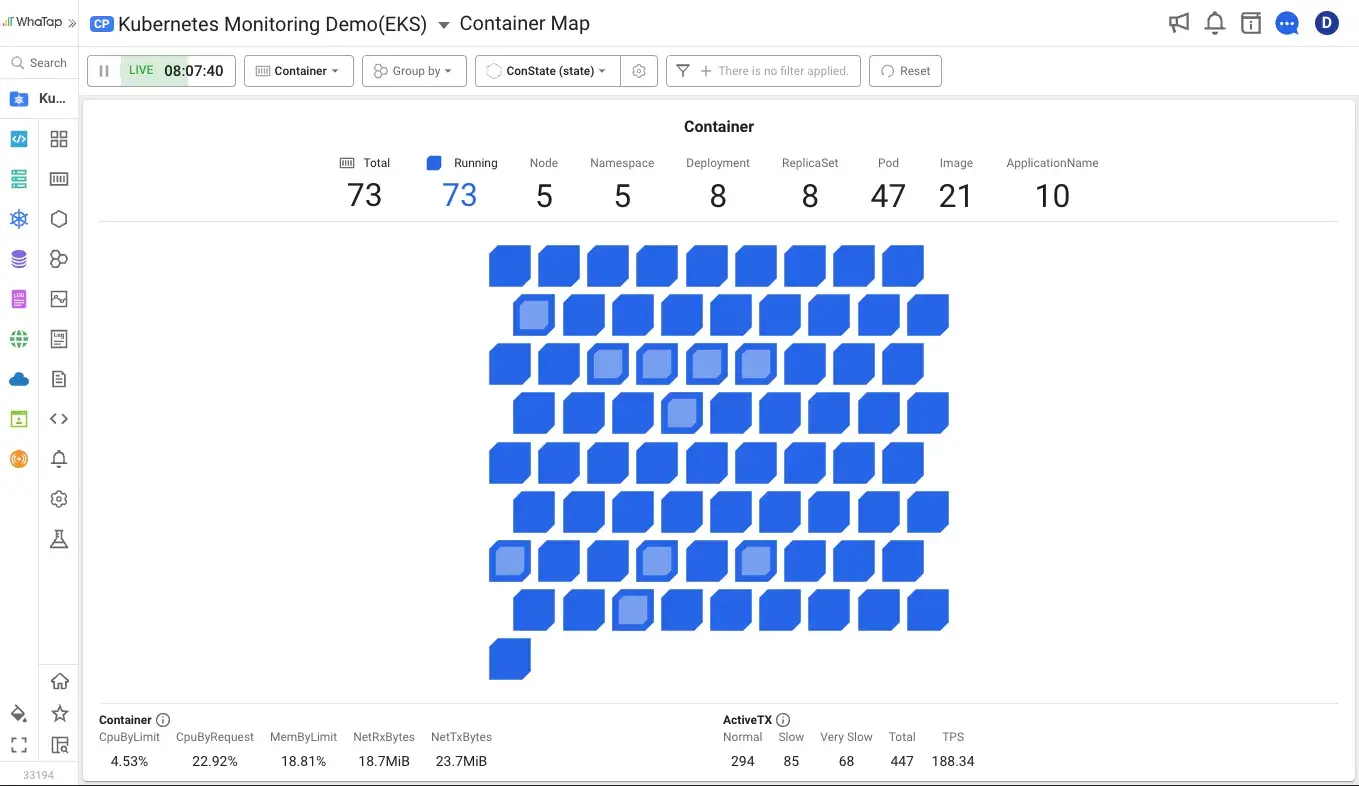
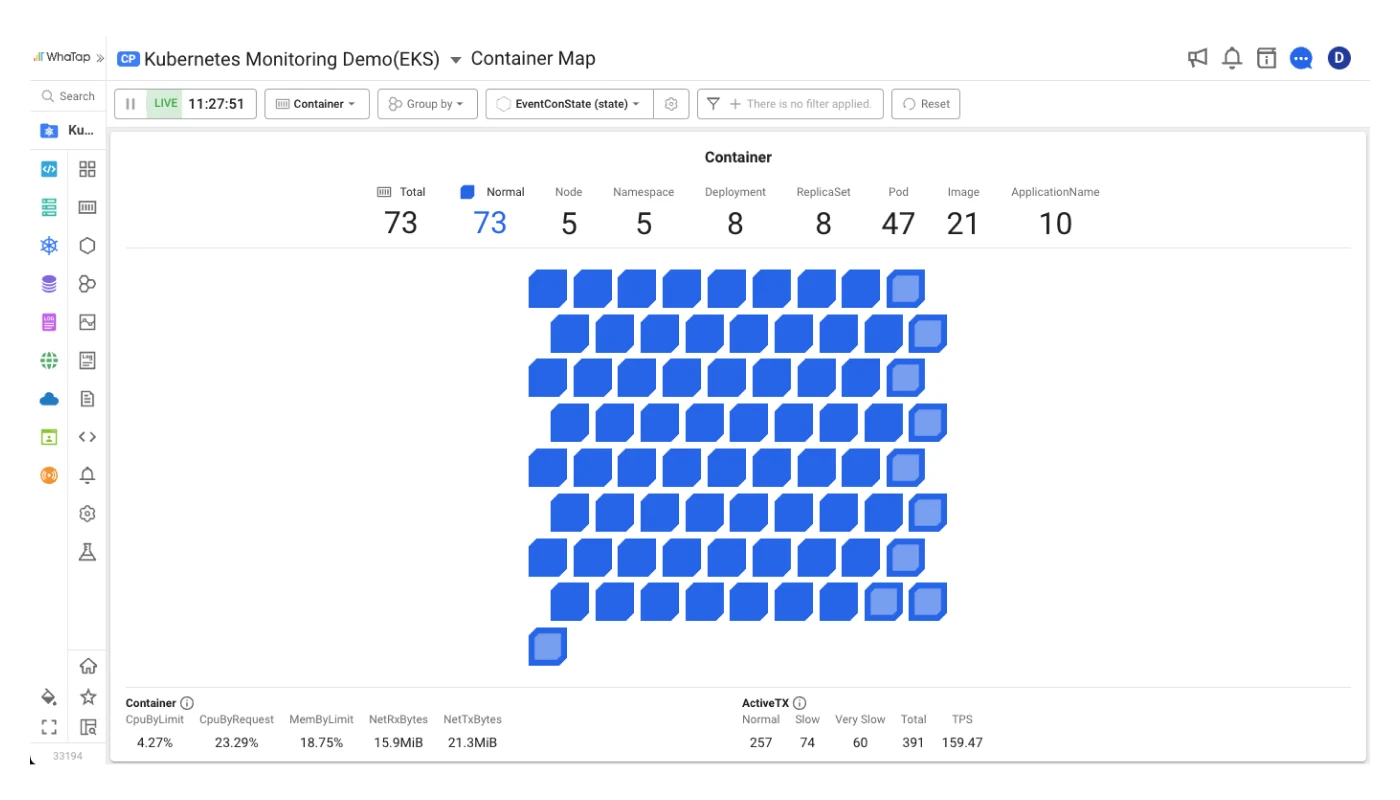
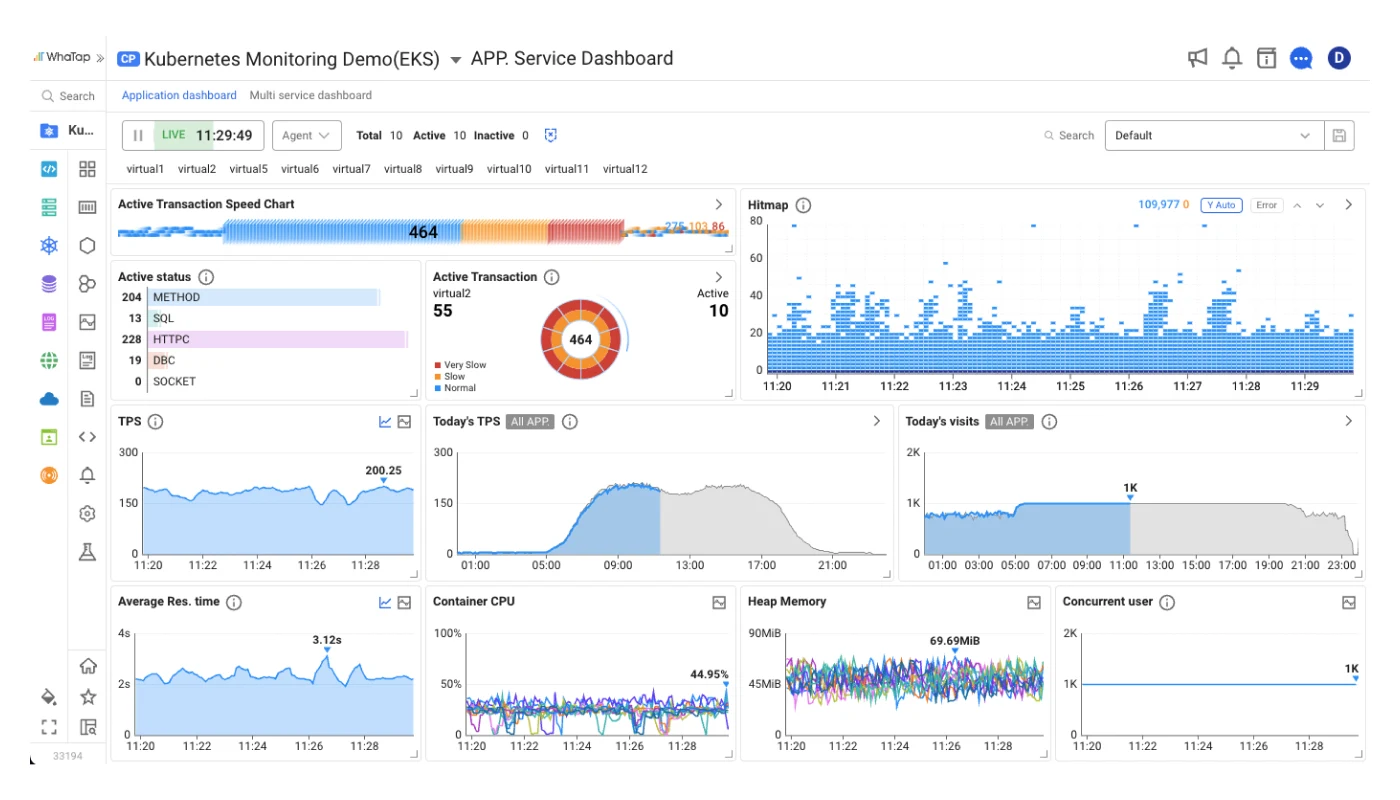
This real-time dashboard allows for customized monitoring of the status and performance in the container environment. It provides integrated viewing, grouping, and filtering for metrics, traces, logs, and events, enabling quick root cause tracing through various visualization options.
List of components
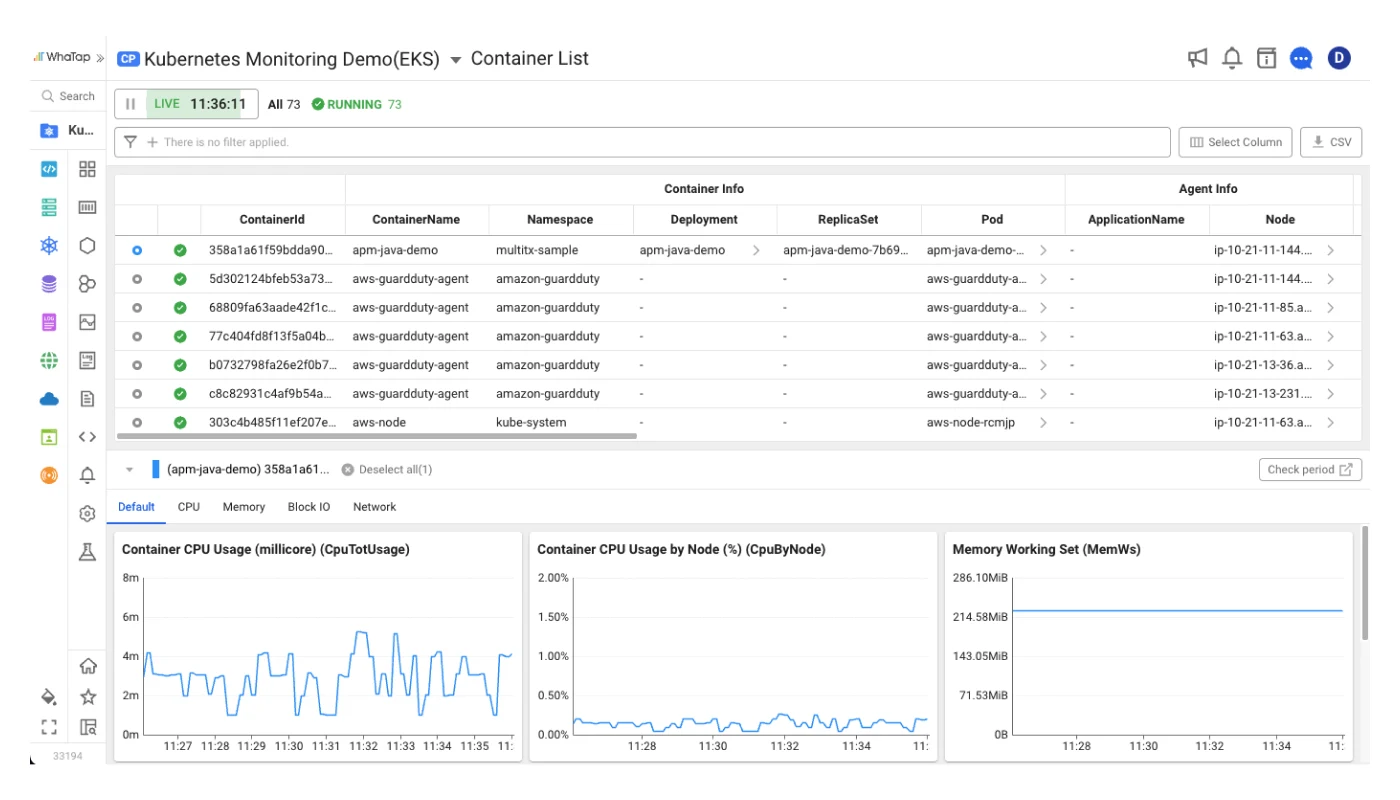
For analysis, you can closely compare the overall status and performance data of Kubernetes components such as containers, pods, nodes, and applications.
Correlations
Based on tags, the root cause tracing is possible by integrating and searching data among WhaTap applications, servers, and database monitoring projects.
Object Manifest Information
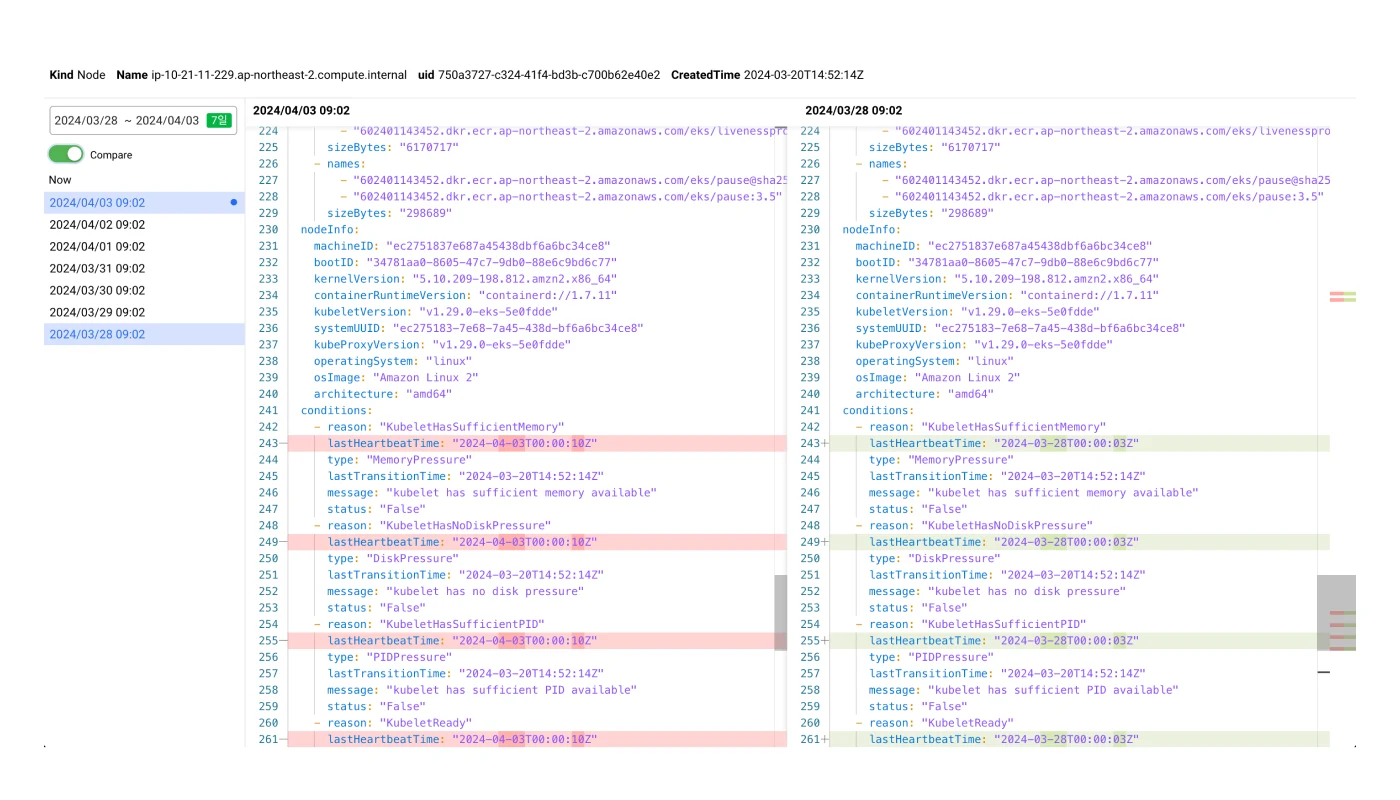
You can check the manifest of Kubernetes objects on the screen without executing commands. In addition to checking object manifests, you can also compare current and past manifests, as well as those from different past times, allowing you to trace changes more easily and quickly.































Supported platforms
WhaTap Kubernetes Monitoring supports various platforms.

Accordion

Cocktail Cloud

NAVER Cloud Kubernetes Service (NKS)

NHN Kubernetes Service (NKS)

Kakao i Cloud

Amazon EKS

Azure AKS

Google GKE

OpenShift
OracleOKE

Rancher