추천 서비스
와탭이 추천하는 서비스를 한눈에 확인해 보세요.
 쿠버네티스
쿠버네티스
컨테이너맵을 통해 메트릭스, 트레이스, 로그를 실시간으로 수집하여 문제 원인을 빠르고 정확하게 분석합니다.
자세히 보기 애플리케이션
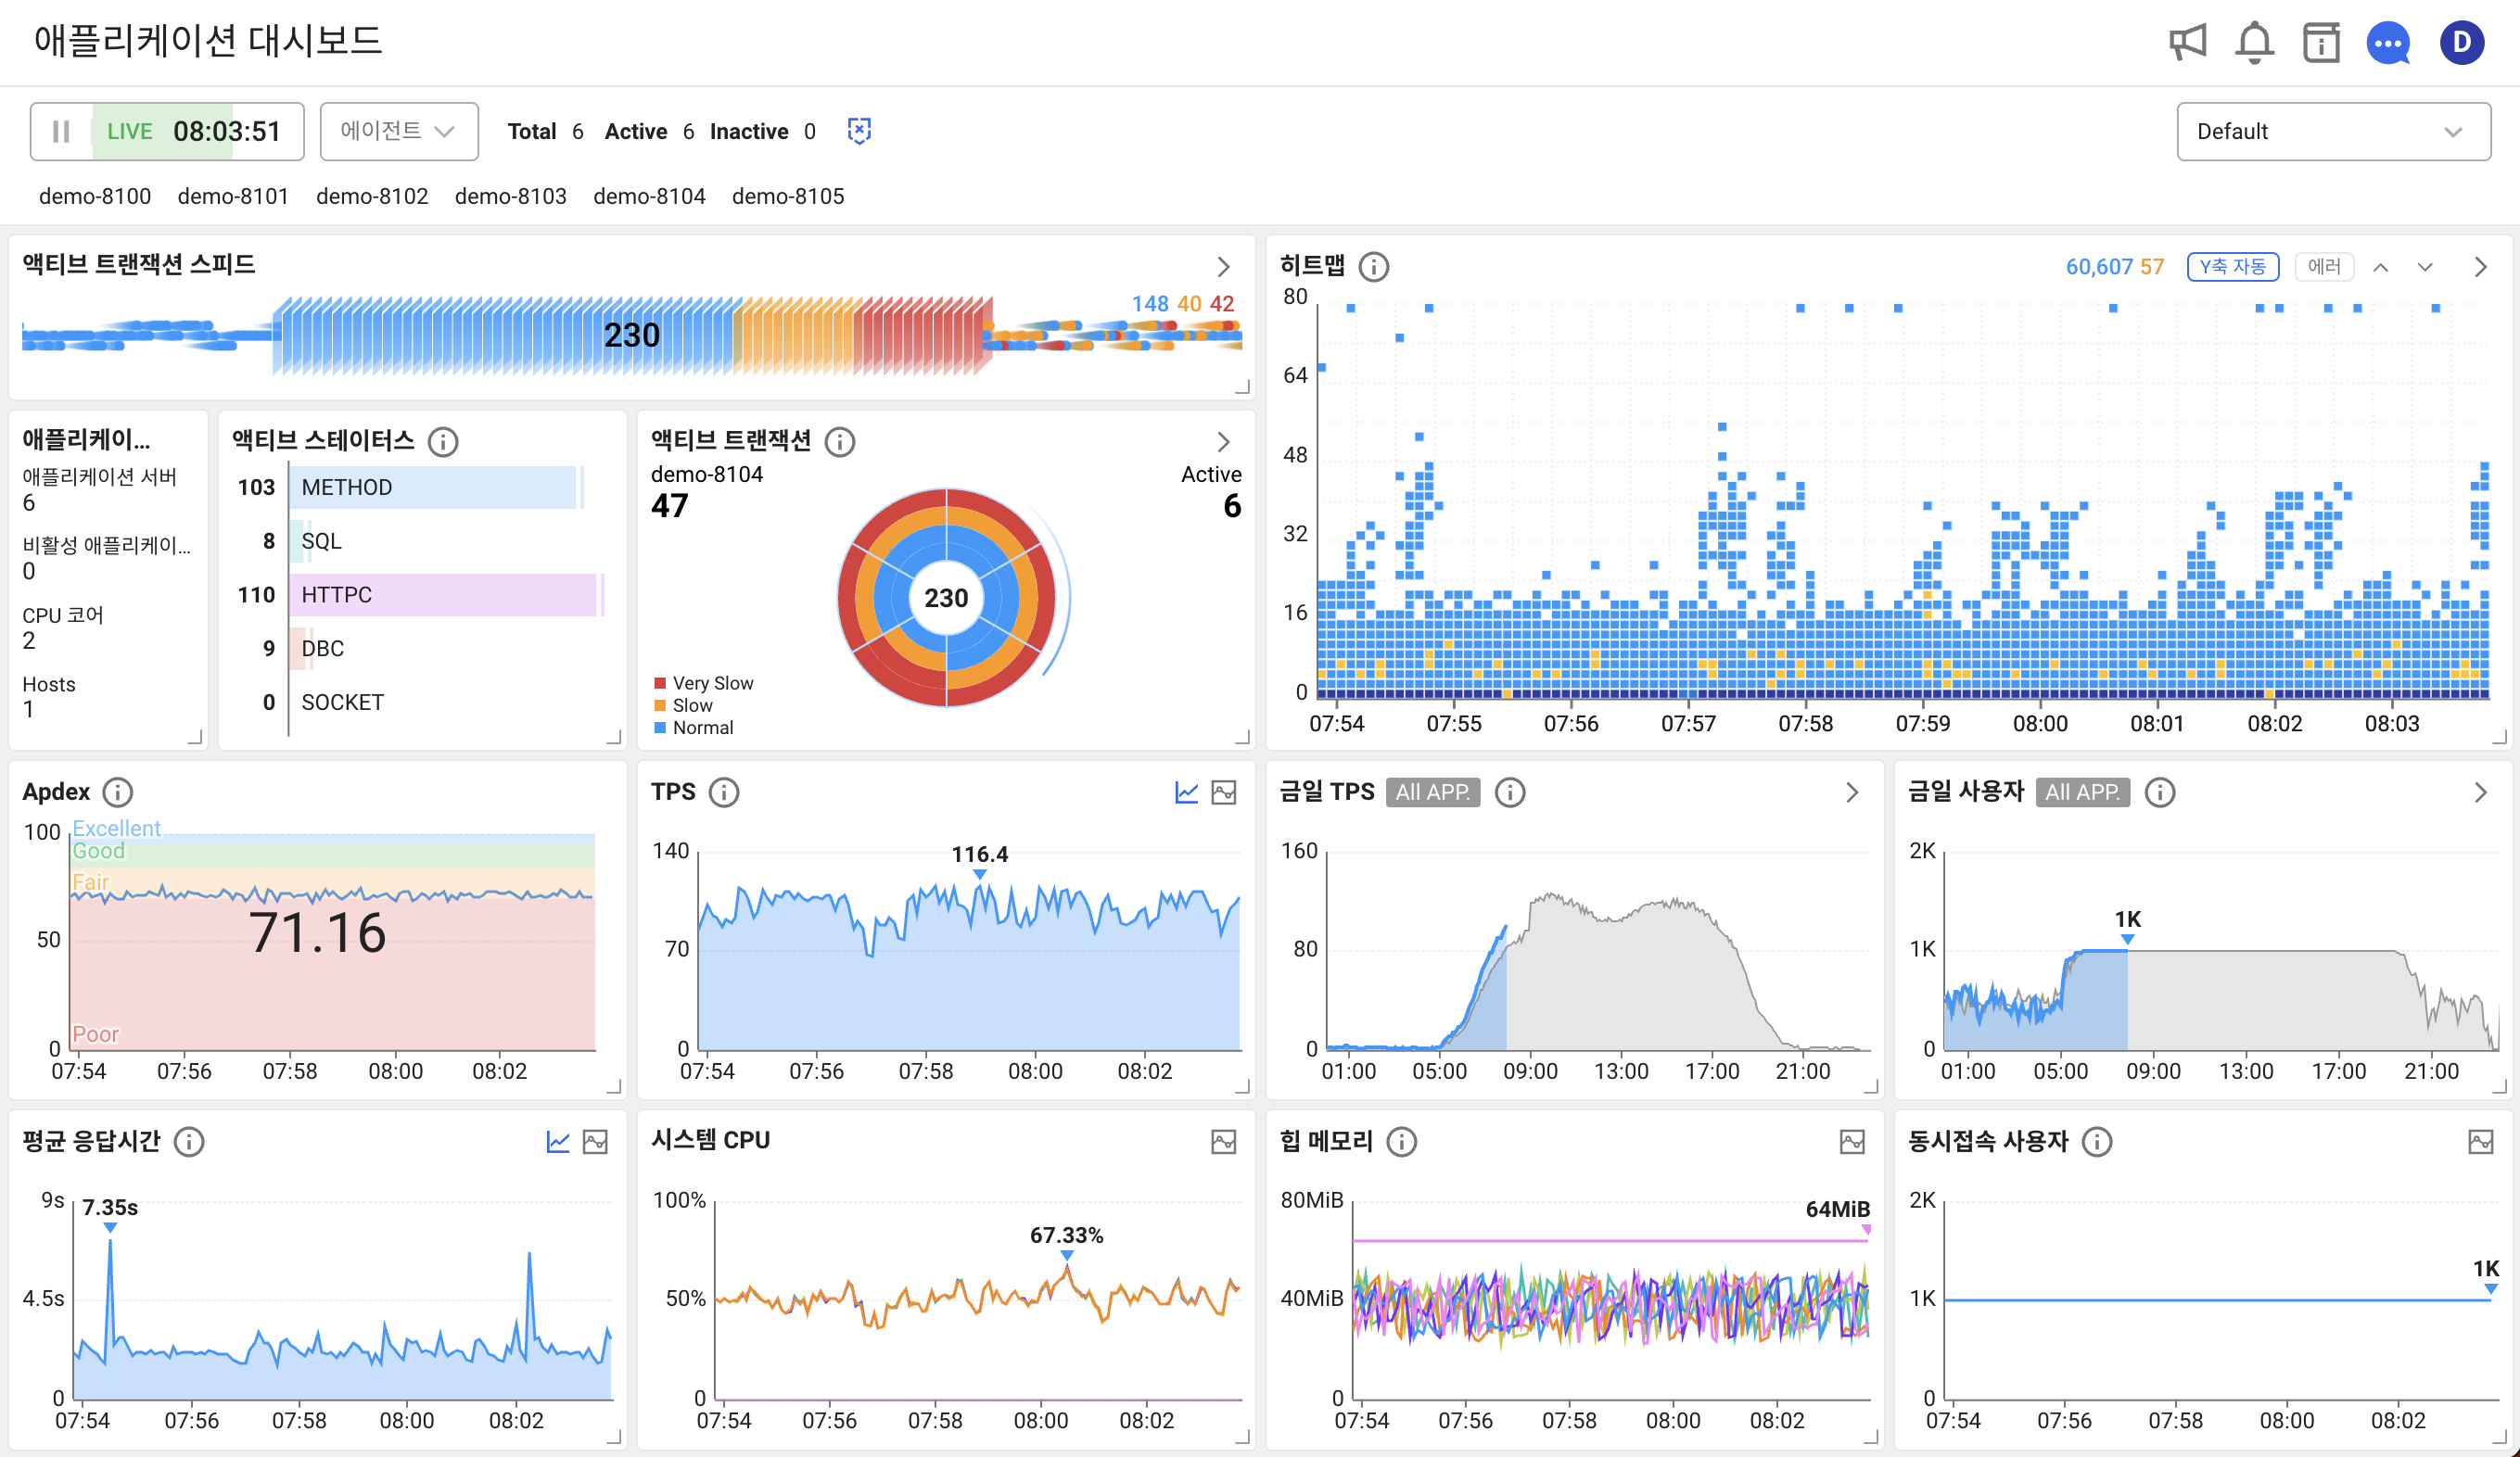
애플리케이션 성능 구간 가시화를 통해 신속하게 장애 구간을 판단할 수 있습니다.
자세히 보기 데이터베이스
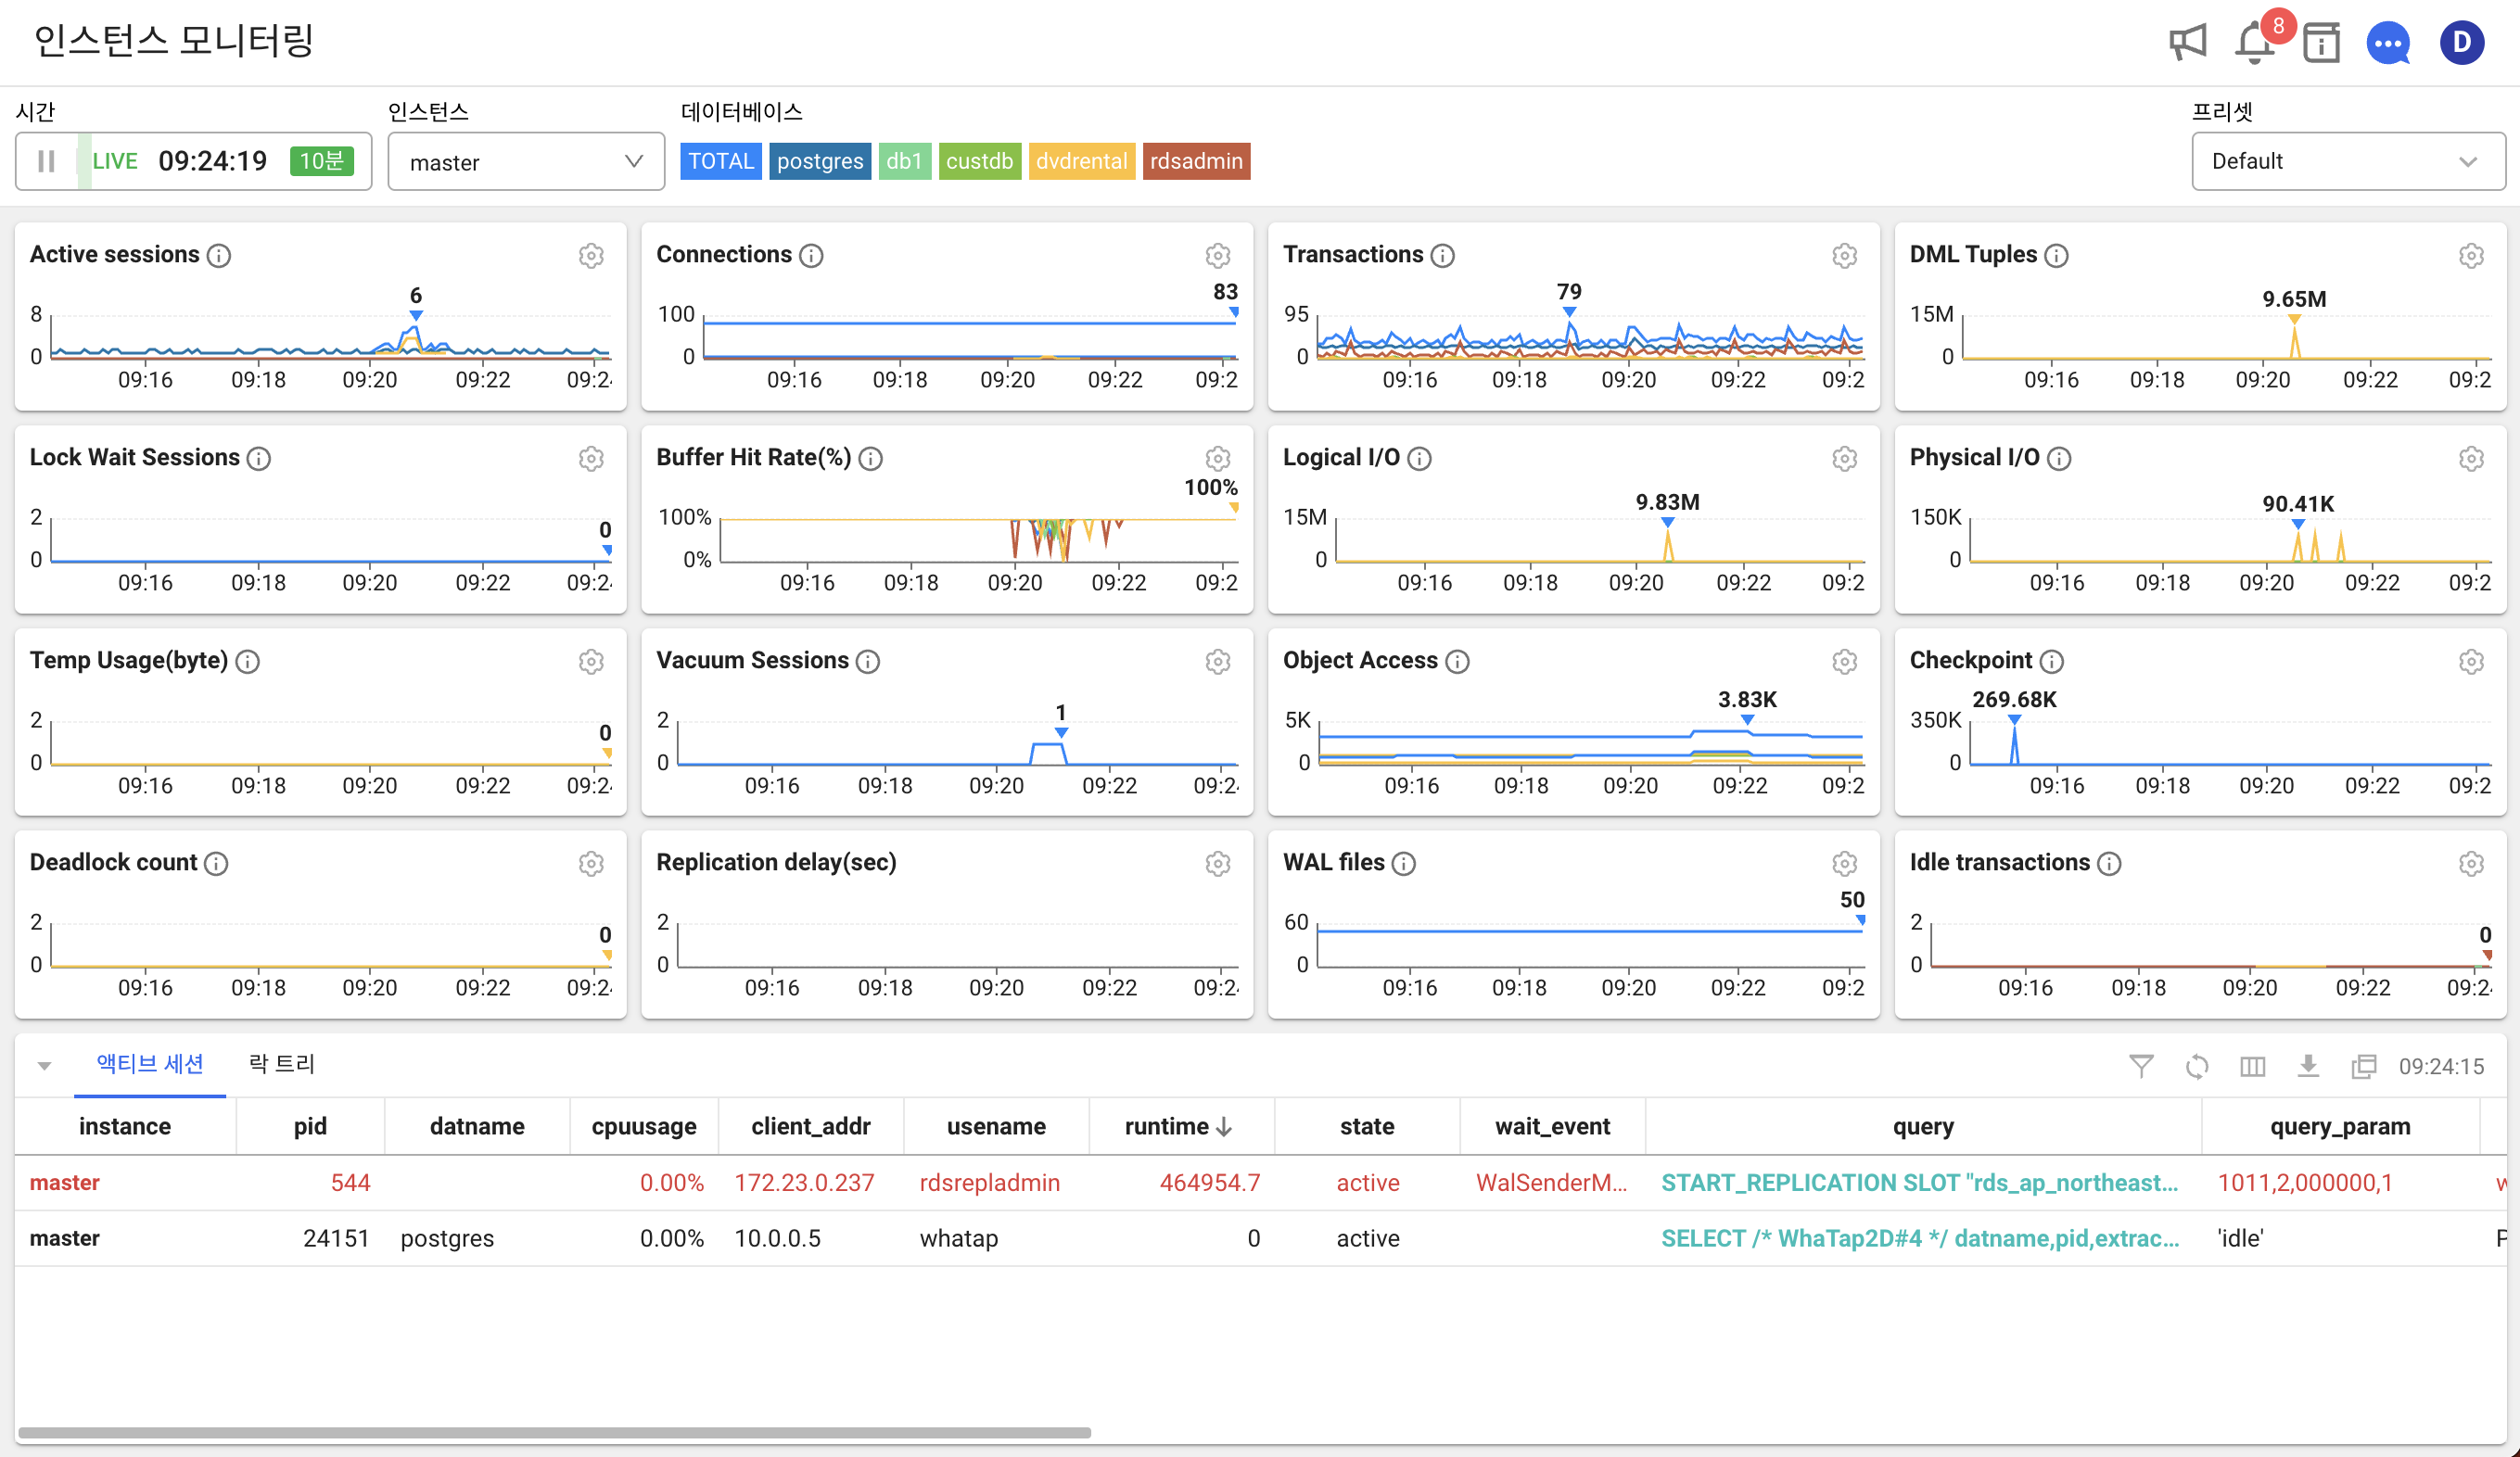
데이터베이스 동작을 실시간으로 감시하고 진단 및 분석하여 가용성과 성능을 일정한 수준으로 유지합니다.
자세히 보기 서버
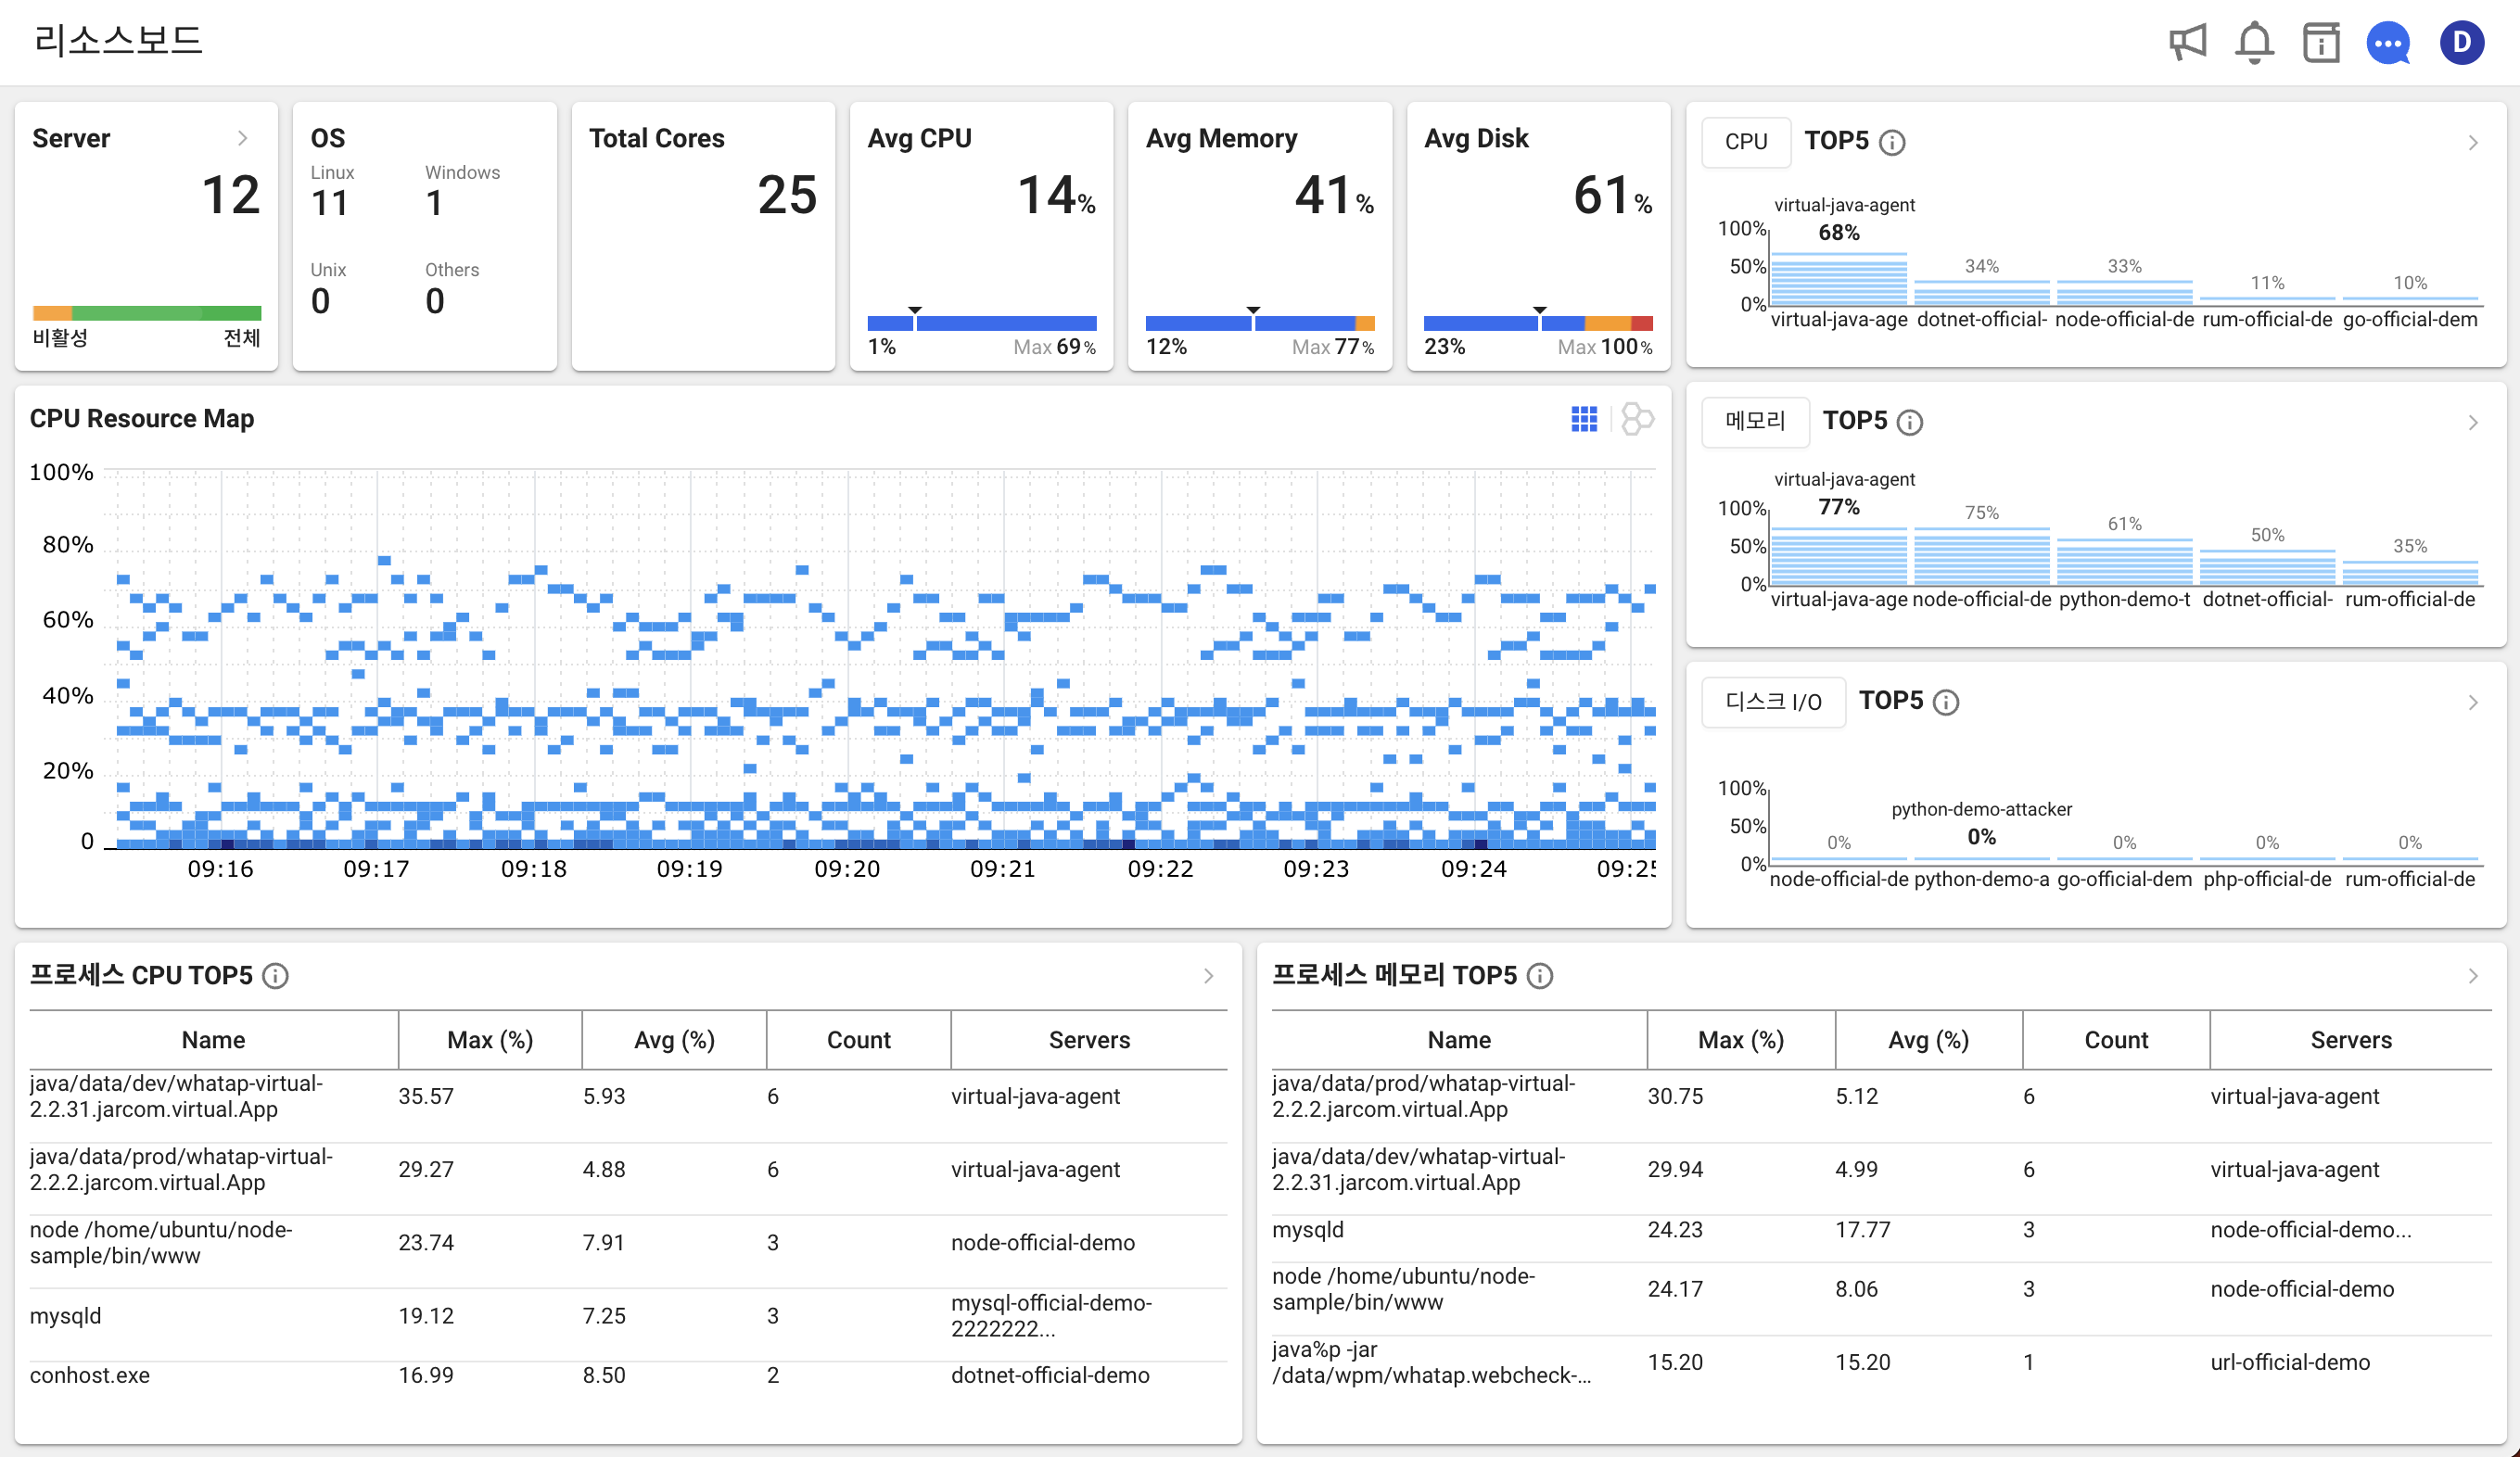
서버
클라우드 기반 통합 모니터링에 최적화되어 쉽고 편하게 시스템 전체 현황을 관리할 수 있습니다.
자세히 보기 URL
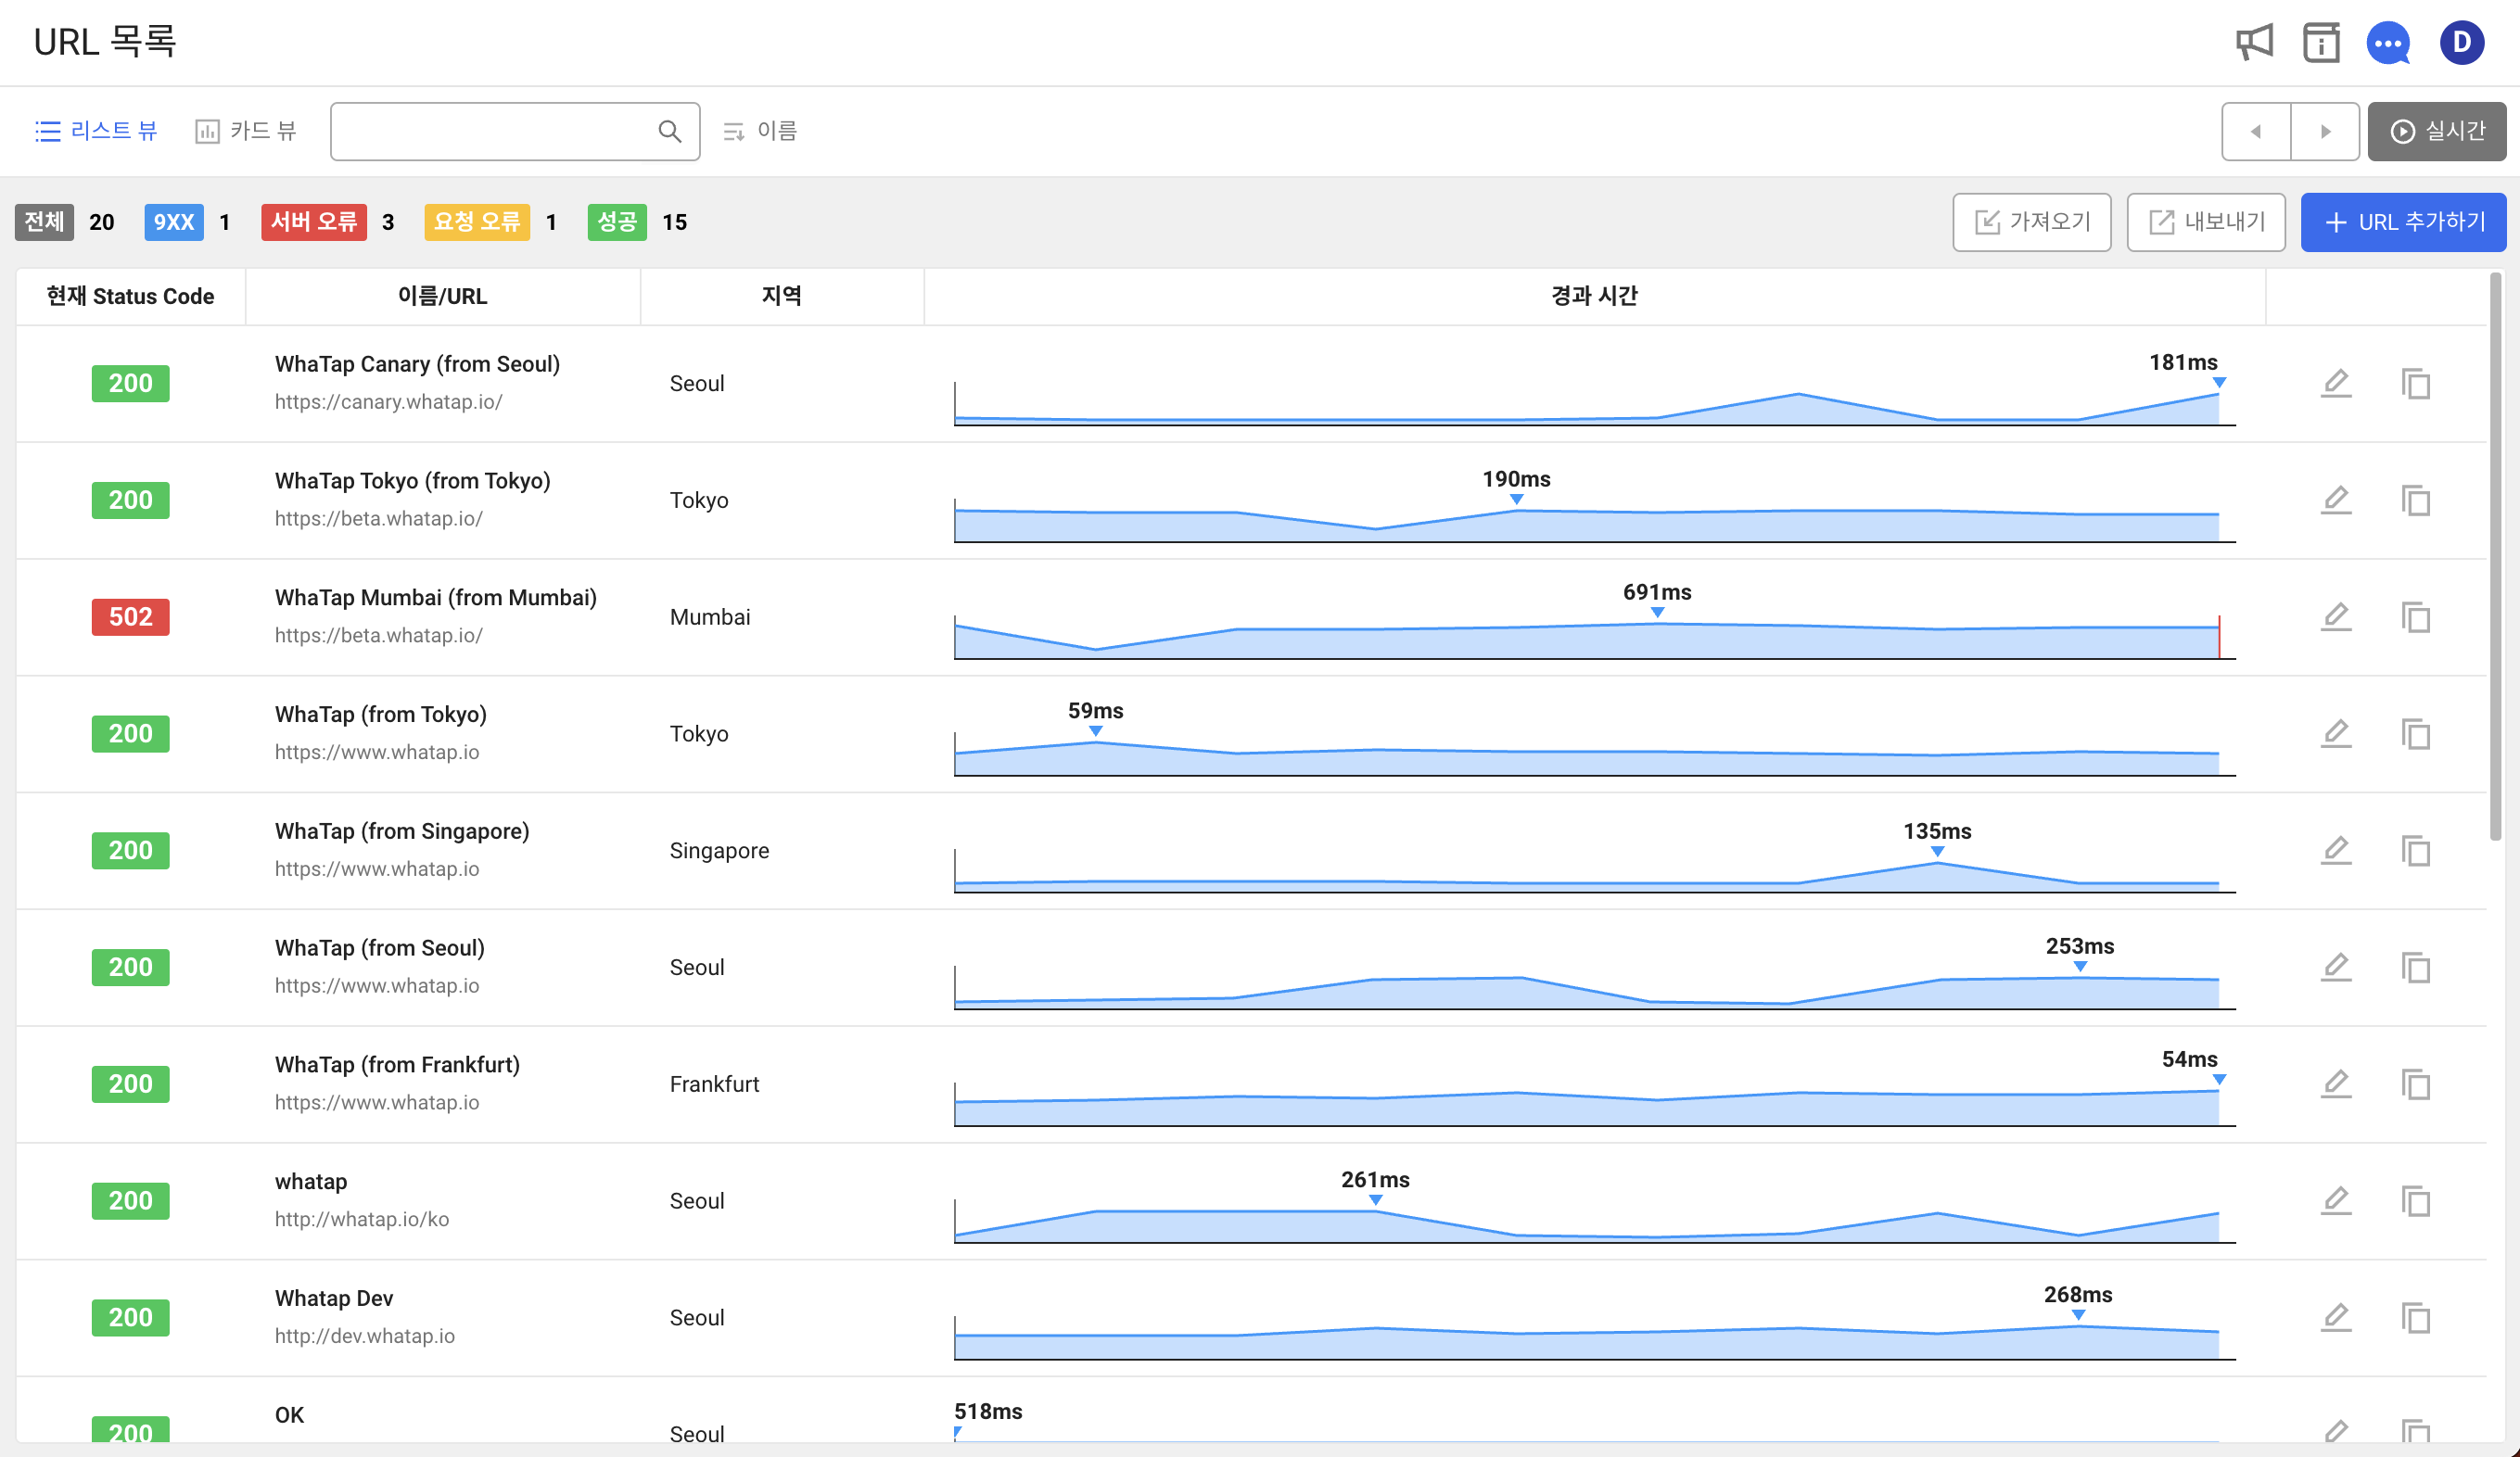
URL
사용자 입장에서 웹 사이트의 정상 접근 여부를 브라우저 등을 통해 점검하는 과정을 대신하여 자동으로 체크합니다.
자세히 보기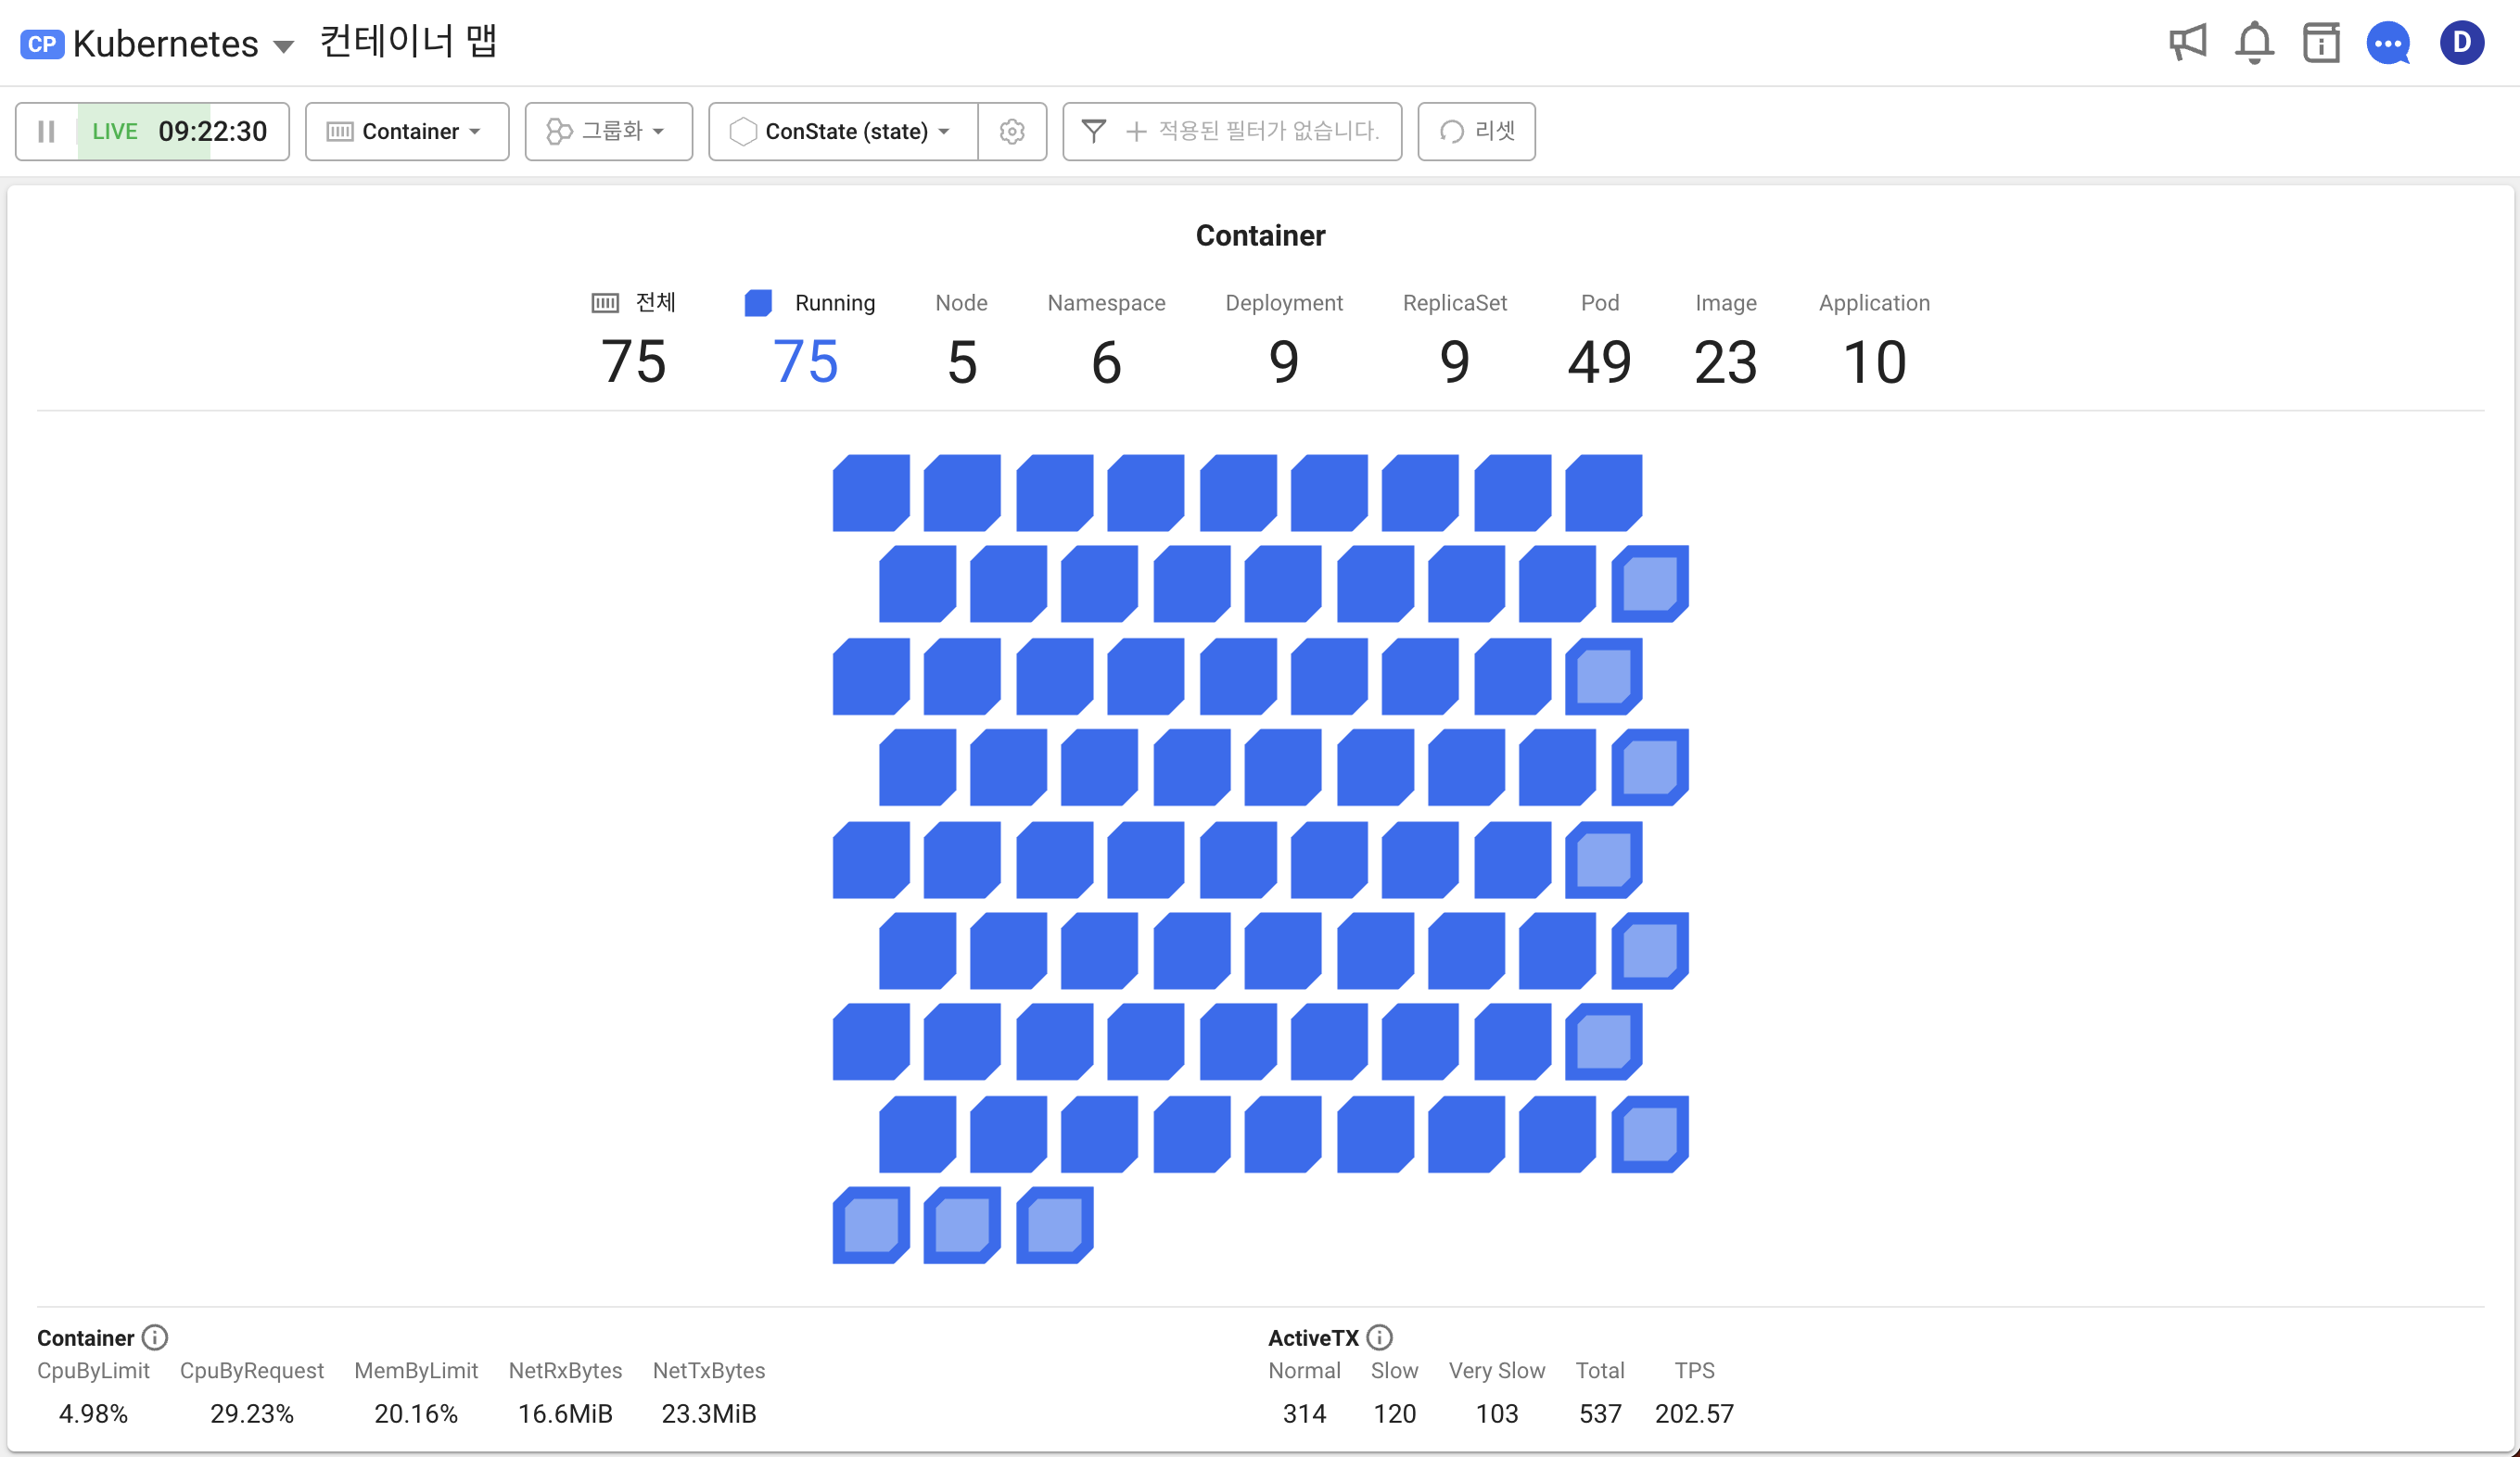
인증 받은 기술력
와탭만의 우수한 기술력으로 발전된 모니터링 서비스를 제공합니다.
-

ISO27701
개인정보보호 관리체계(PIMS)에 관한 국제 표준 인증
-

KCSP 인증
쿠버네티스 서비스를 수행하는 역량과 경험을 보유한 기업 인증
-

CSAP 인증
클라우드컴퓨팅 서비스 정보보호에 관한 기준 적합 인증
-

GS 인증
Good Software 1등급 기준 적합 인증
-

AWS Partner
AWS 소프트웨어 패스 AWS Qualified Software 획득
-

ISO/IEC 27001
정보보호경영시스템에 관한 국제 표준 인증
-

ISO/IEC 27017
클라우드 서비스 정보보호 관리체계에 관한 국제 표준 인증
-

ISO/IEC 27018
클라우드 서비스 개인정보 관리체계에 관한 국제 표준 인증
-

CSA Star level1
클라우드 업계에서 가장 강력한 보증 프로그램인 국제 클라우드 보안 인증 보유
강력한 기능
최적의 모니터링 경험을 제공하기 위해 다양한 기능을 지원합니다.
-
SaaS 서비스
IT 모니터링에 필요한 모든 기능을 One-Stop SaaS 서비스로 제공합니다.
-
통합 모니터링
다양한 서비스를 제공하여 와탭 하나로 통합 모니터링을 할 수 있습니다.
-
실시간 조회
원하는 과거 시점은 물론 실시간 상태까지 한눈에 파악할 수 있습니다.
-
최신 기술
고객의 상황에 맞는 데이터와 최신 기술을 활용해 장애를 구별할 수 있는 선구안을 제공합니다.
-
데이터 암호화
모든 데이터는 암호화되어 저장되기 때문에 안심하고 사용할 수 있습니다.
-
직관적인 모니터링
한 화면에서 필수적인 내용을 확인할 수 있는 가시성을 제공해 장애를 빠르게 식별할 수 있습니다.