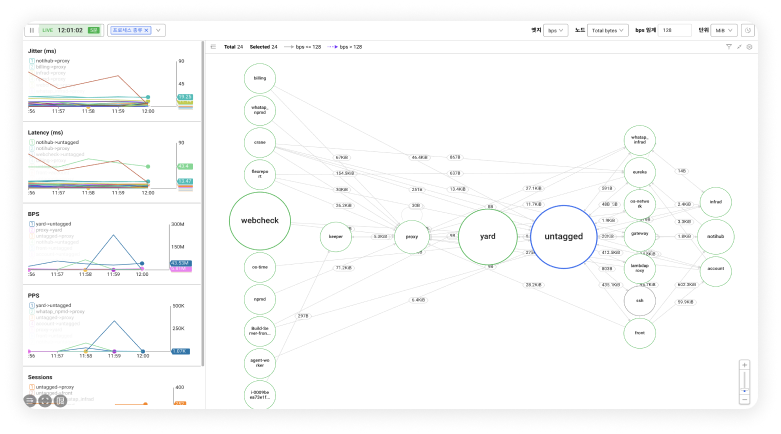
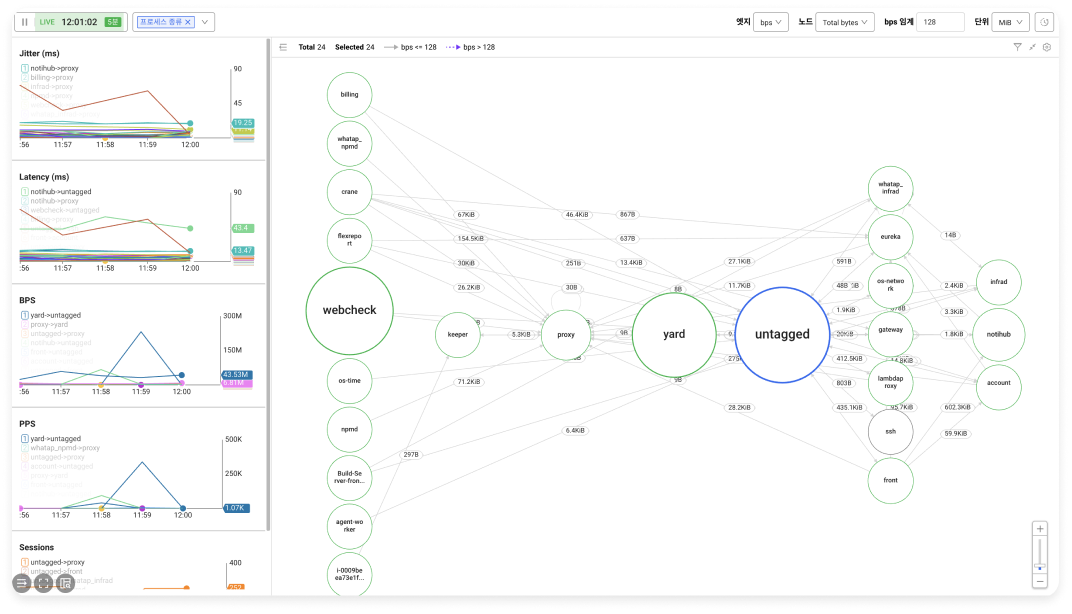
Email
network_main_dashboard
WhaTap Network Performance Monitoring

Read the weblike network communications and reveal the quality and performance of all network connnections.

Topology chart is a short cut to an at-a-glance view of the relationships between nodes. This can be paired with metric-specific linear charts to enable quick discovery on network performance of a section in your your network.

Reasons you should use WhaTap Network Performance Monitoring

"Complexities that have been resulted by transition from monolithic architectures to micro-service architectures make it difficult to cope with failures. Nowadays, service configurations are becoming more complex, making it increasingly difficult to respond to failures."

In order to react quickly to failures, it's important to have a bird's eye view of the complex connectivity of your service layer.

In addition, eBPF technology is sandbox-based and stable.

WhaTap's network performance monitoring utilizes eBPF technology to collect data. Because eBPF technology allows you to collect various events that occur in the kernel, you can get detailed information at the process-level.

View saved history for detailed troubleshooting.

Even if you don't have access to the server or the outage has already been resolved, you can still get an indication of the state of your network at any given time. You can identify issues with the servers and processes involved, and you can extract data to learn more.

Tagging options make it easy to understand complex networks.

Tagging options allow you to group and simplify diverse and complex network data and monitor abstract network performance with visibility.

Use the Flex board and make customized charts

It offers a wide range of metrics, so you can use the information you collect to create a variety of custom charts based on any metric you want.

Key Features of WhaTap Network Performance Monitoring

In response to the changing landscape for cloud and virtualization, we collect a variety of network data for processes.
Various topologies and numerous charts are constructed based on collected data. By using these visualized metrics, we are able to provide an optimized monitoring experience that allows you to intuitively understand complex components and network status.

Topology dashboard

  • View data in real time and for specific periods in the past
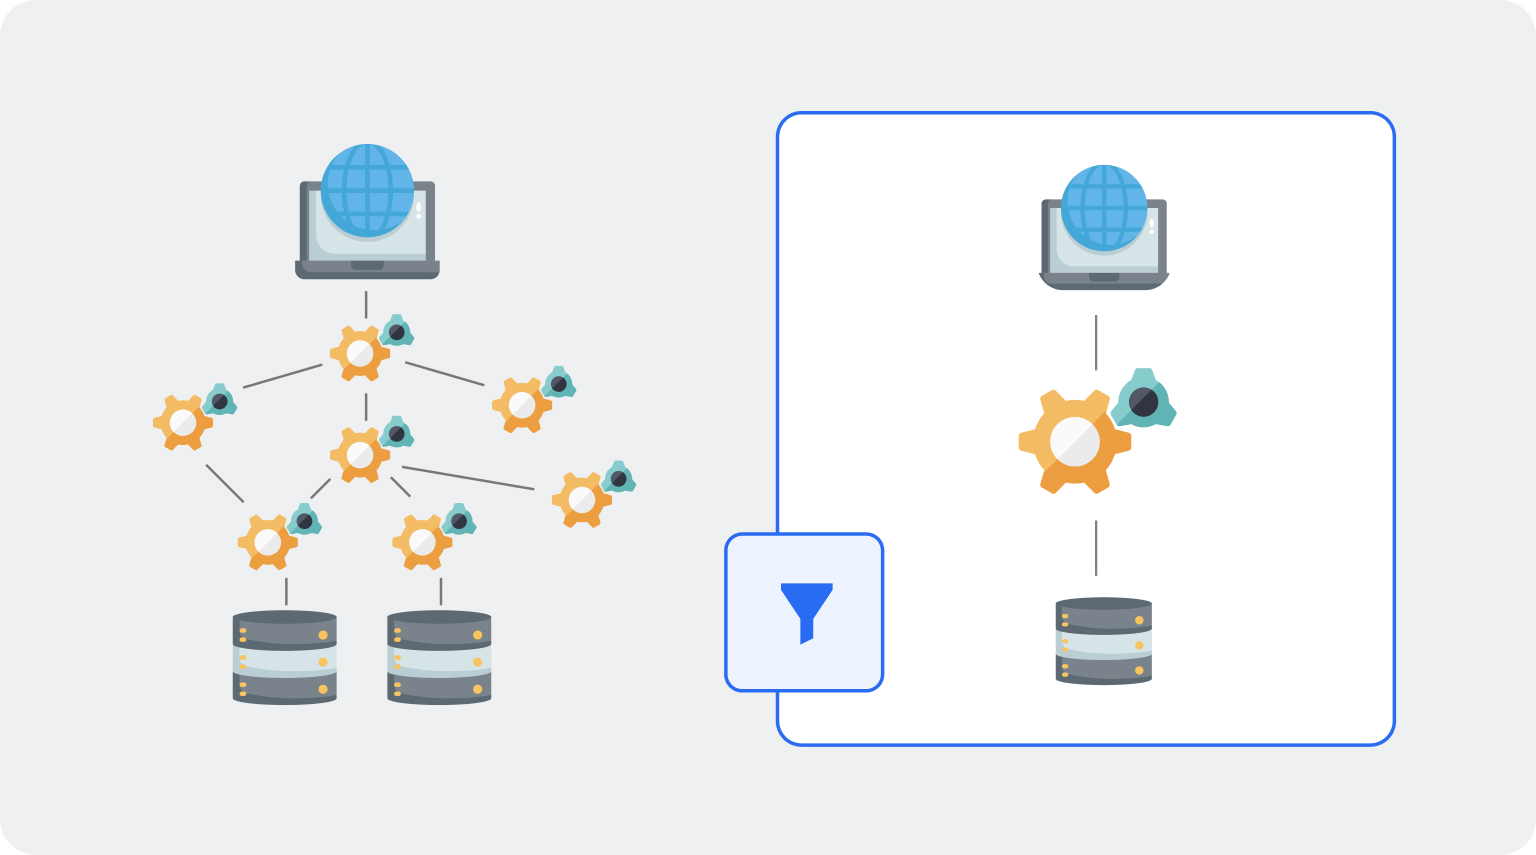
  • Group and simplify your network structure based on "process type" or "application" tags to enhance visibility.
  • Set usage thresholds on call relationships between networks to identify root causes in real-time.
  • Monitor the performance of network segments in conjunction with metric-specific linear charts
network_main_dashboard

network_main_dashboard

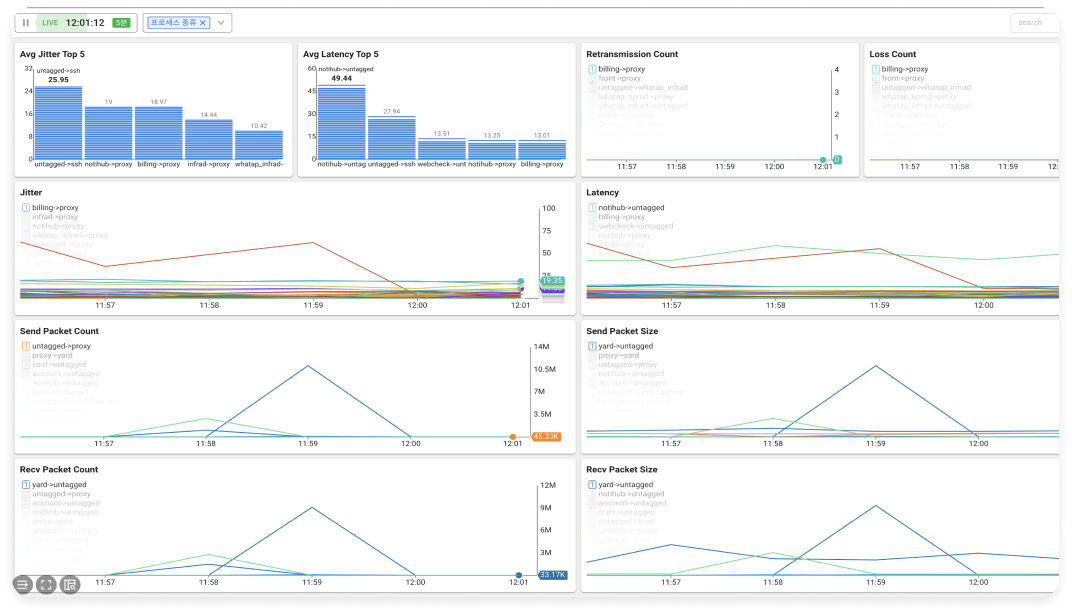
Analyze network trends

  • Get an oranized view of performance in numerical terms, all on one screen
  • Identify and examine changes in network metrics as a whole
  • Get real-time performance information over time
  • View historical performance data and analyze past issues
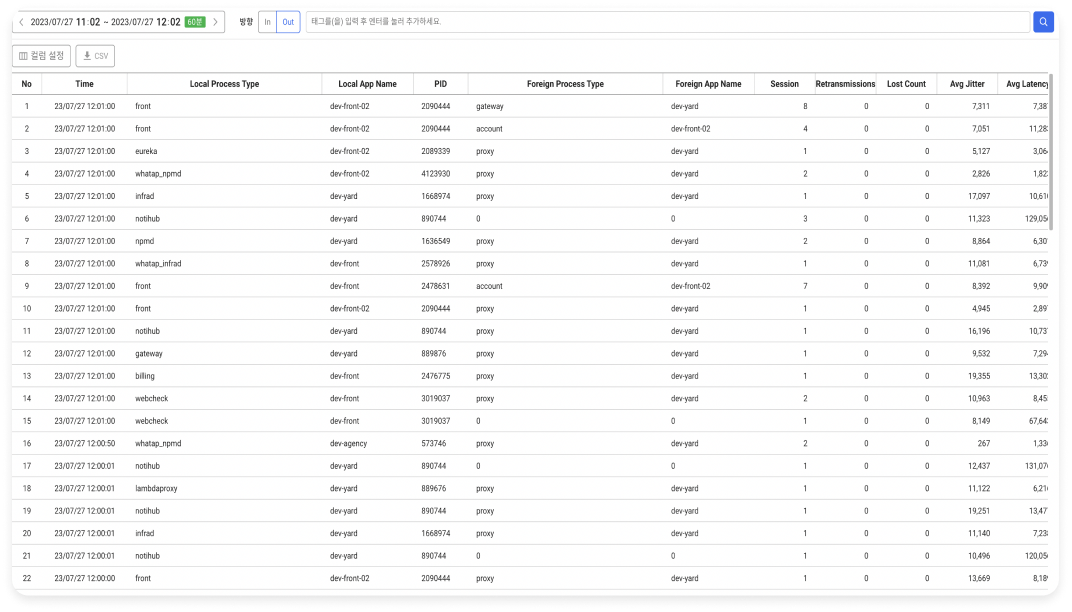
TCP/UDP Analysis

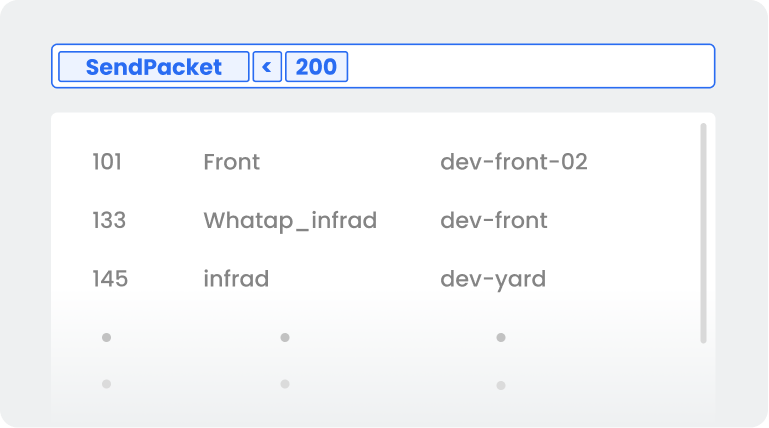
  • View session data by a variety of criteria to identify granular points of failure.
  • Search efficiently using multi-criteria filters
  • Get a CSV file and utilize data in a variety of ways
network_main_dashboard