.svg)
%201.svg)

담당자가 프로모션 코드를 발송해 드립니다.
와탭을 경험해 보세요.
와탭을 경험해 보세요.
와탭을 경험해 보세요.
와탭을 경험해 보세요.
와탭을 경험해 보세요.
와탭을 경험해 보세요.
와탭을 경험해 보세요.
와탭을 경험해 보세요.
Understanding the TPS Metric

When Startups Should Start Looking at the TPS Metric
Many early-stage startups don’t pay much attention to performance. They’re already busy just building the product, so it’s difficult to focus on performance as well. Even if users suddenly surge, it’s easy to assume that Amazon Auto Scaling will take care of it.
In fact, for startups that need to prove value quickly, there’s no urgent need to focus on performance from day one. However, once monthly AWS infrastructure costs begin to exceed about 10 million KRW, the situation starts to change. At that point, teams begin to question whether their service is using infrastructure efficiently and how to justify the growing costs.
The moment you start wanting clear performance indicators for your system—that’s exactly when you should begin monitoring the TPS metric.

How TPS is calculated
Transaction Per Second (TPS) represents the number of transactions processed per second. It is calculated by counting the number of transactions executed over a given period and then converting that value into a per-second rate.
In WhaTap’s case, values are collected at 5-second intervals. Therefore, the number of transactions aggregated during that period is divided by five to display the TPS.
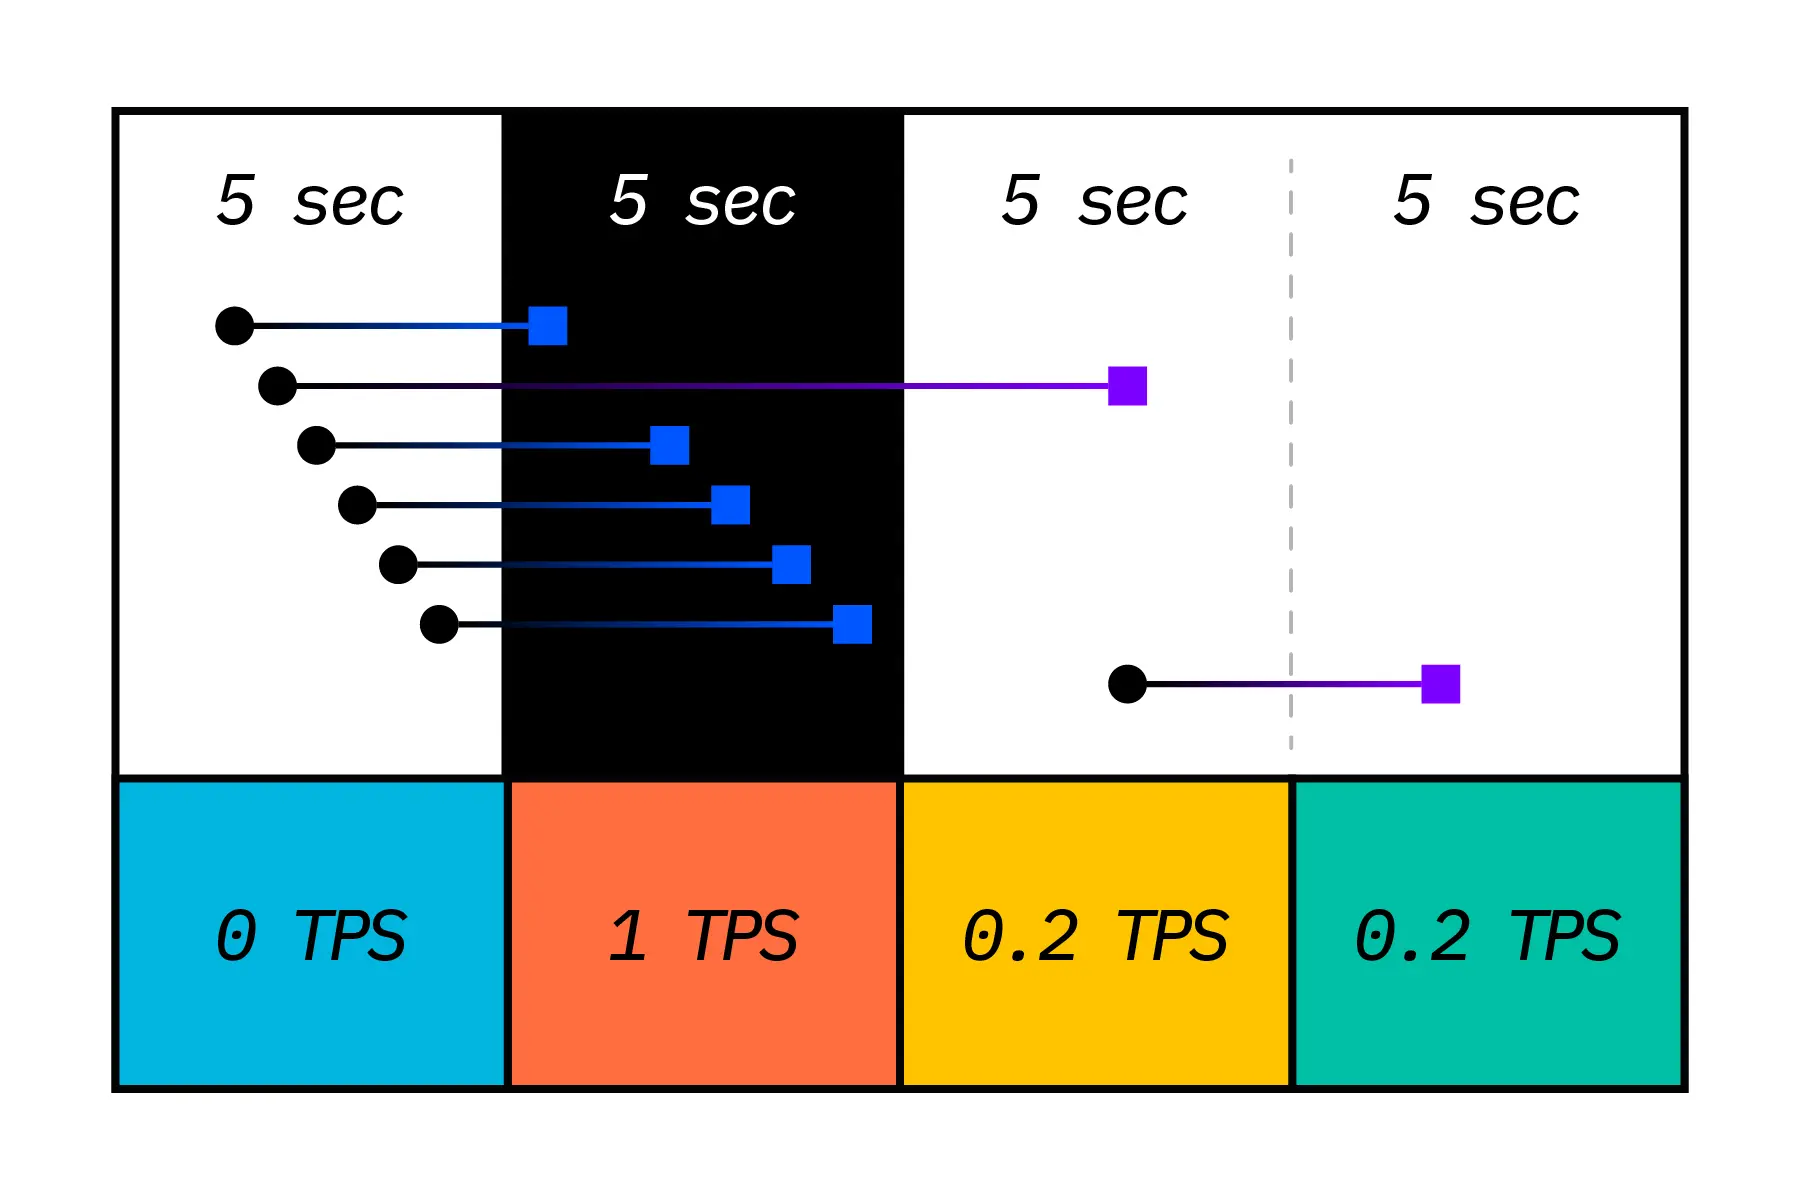
For example, if five transactions are completed over five seconds, the TPS would be calculated as: 5 transactions / 5 seconds = 1 TPS
(WhaTap’s TPS indicator is calculated in a more sophisticated way. To show trends clearly on charts, WhaTap provides a 30-second average TPS updated every 5 seconds.)
Saturation Point and Why TPS Stops Increasing
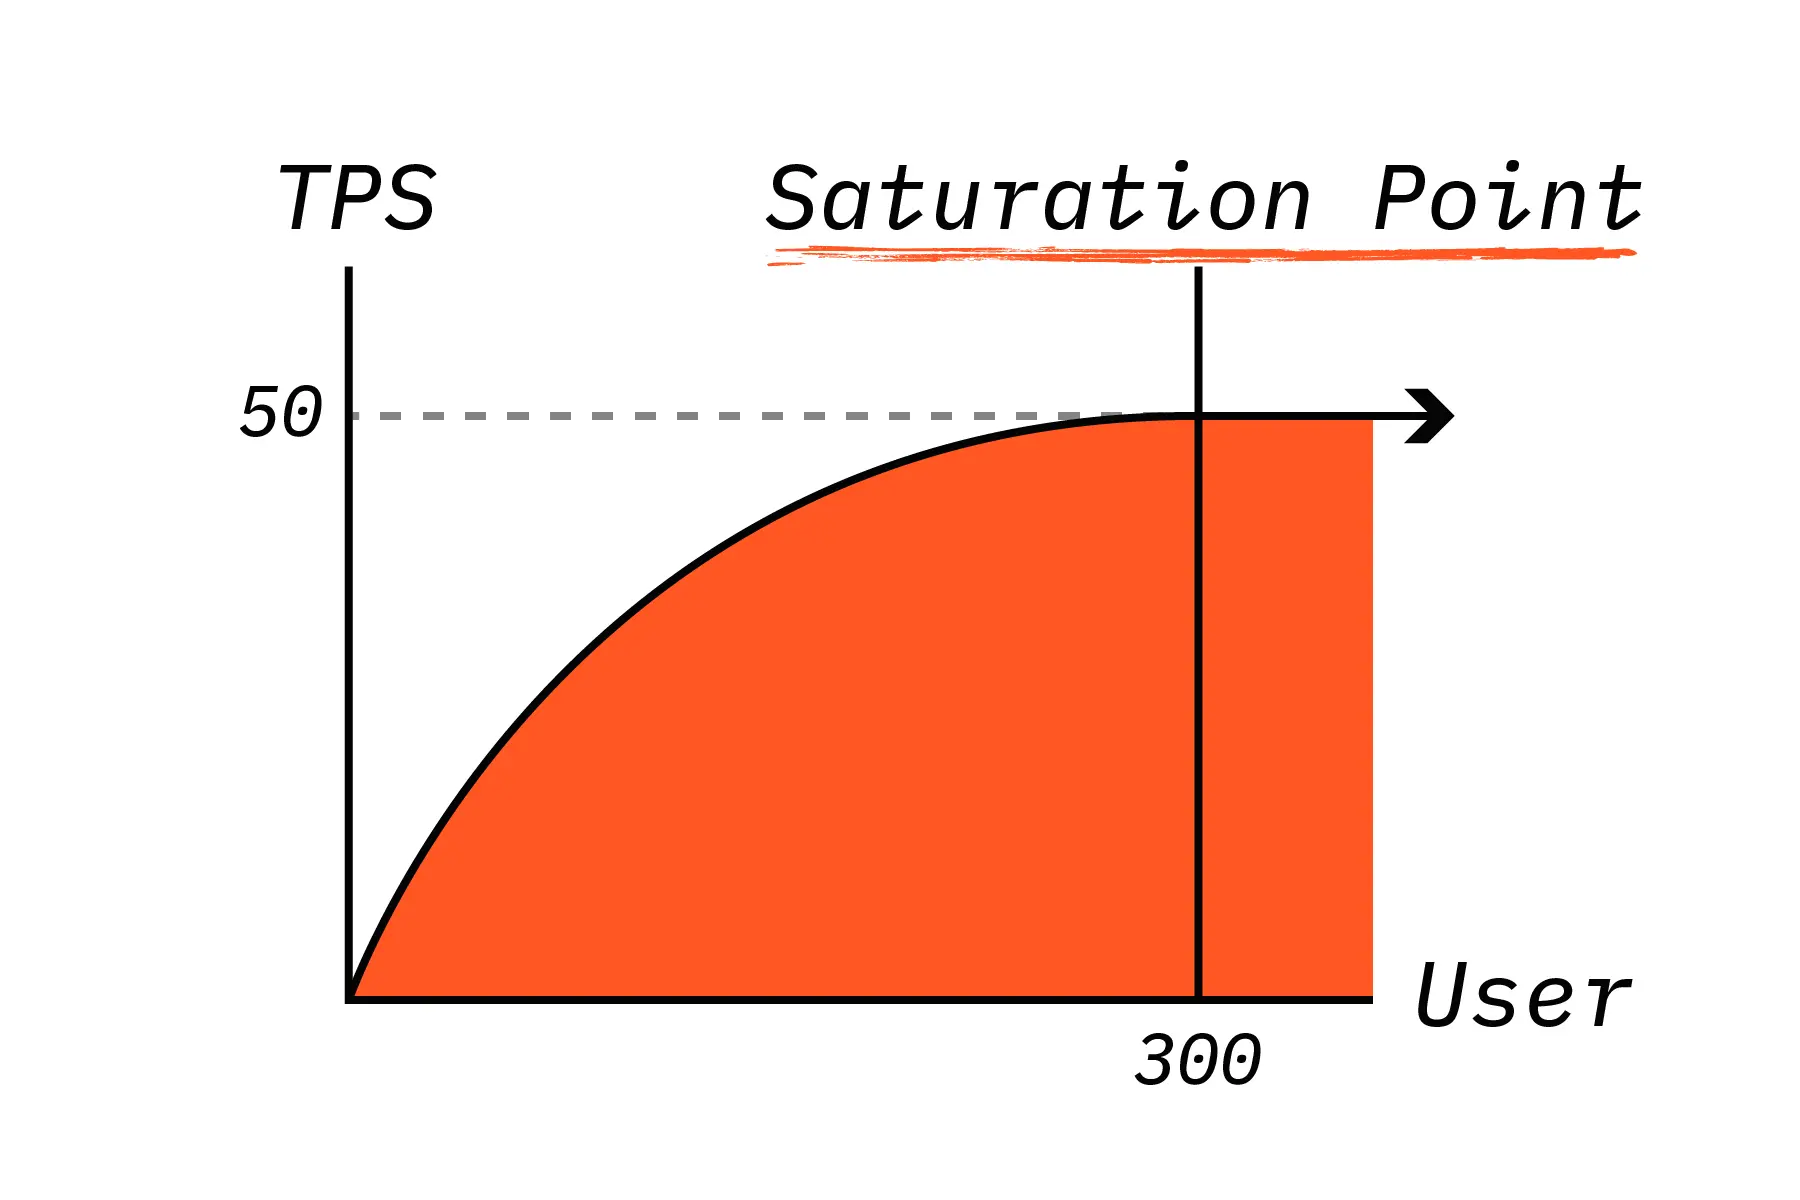
As the number of users continues to grow, there comes a point where TPS no longer increases. This is called the Saturation Point. The illustration above shows an ideal service scenario.
In systems that are not properly tuned, TPS can even decline after passing the saturation point. For example, once concurrent users exceed 300, TPS may become fixed while transaction response time begins to increase.
To illustrate: If TPS is 50 while handling requests from 300 concurrent users, it would take approximately six seconds to process all incoming requests. By defining TPS and expected concurrency in advance, teams can better estimate and visualize service performance.
TPS Summary
- TPS refers to the number of transactions processed per second.
- TPS serves as a baseline indicator of service performance.
- Monitor TPS regularly to identify peak times by day and hour.
- The point where TPS stops increasing is called the saturation point.
- When traffic exceeds this point, response time increases while TPS remains fixed.
If You Want a More Rational View of System Performance
As service traffic grows and infrastructure costs rise, simply adding more servers is no longer enough. Operations should shift toward performance-driven management based on clear metrics.
Use TPS to gain a precise understanding of your service throughput and performance limits. You can start monitoring with WhaTap today. Get Started with WhaTap
.webp)
.webp)