📖 GPU 모니터링 인사이트, 단 한권에 정리했습니다
Top
Contact
Simplify network management. Smarter operations
Network Monitoring
(NMS)
Ensure visibility and stability across network infrastructure
using standard protocols like SNMP, Syslog, and ICMP.
Why Do You Need NMS?
The network is the physical foundation of your services. Without proper visibility,
issues cannot be prevented—and stable operations become impossible.
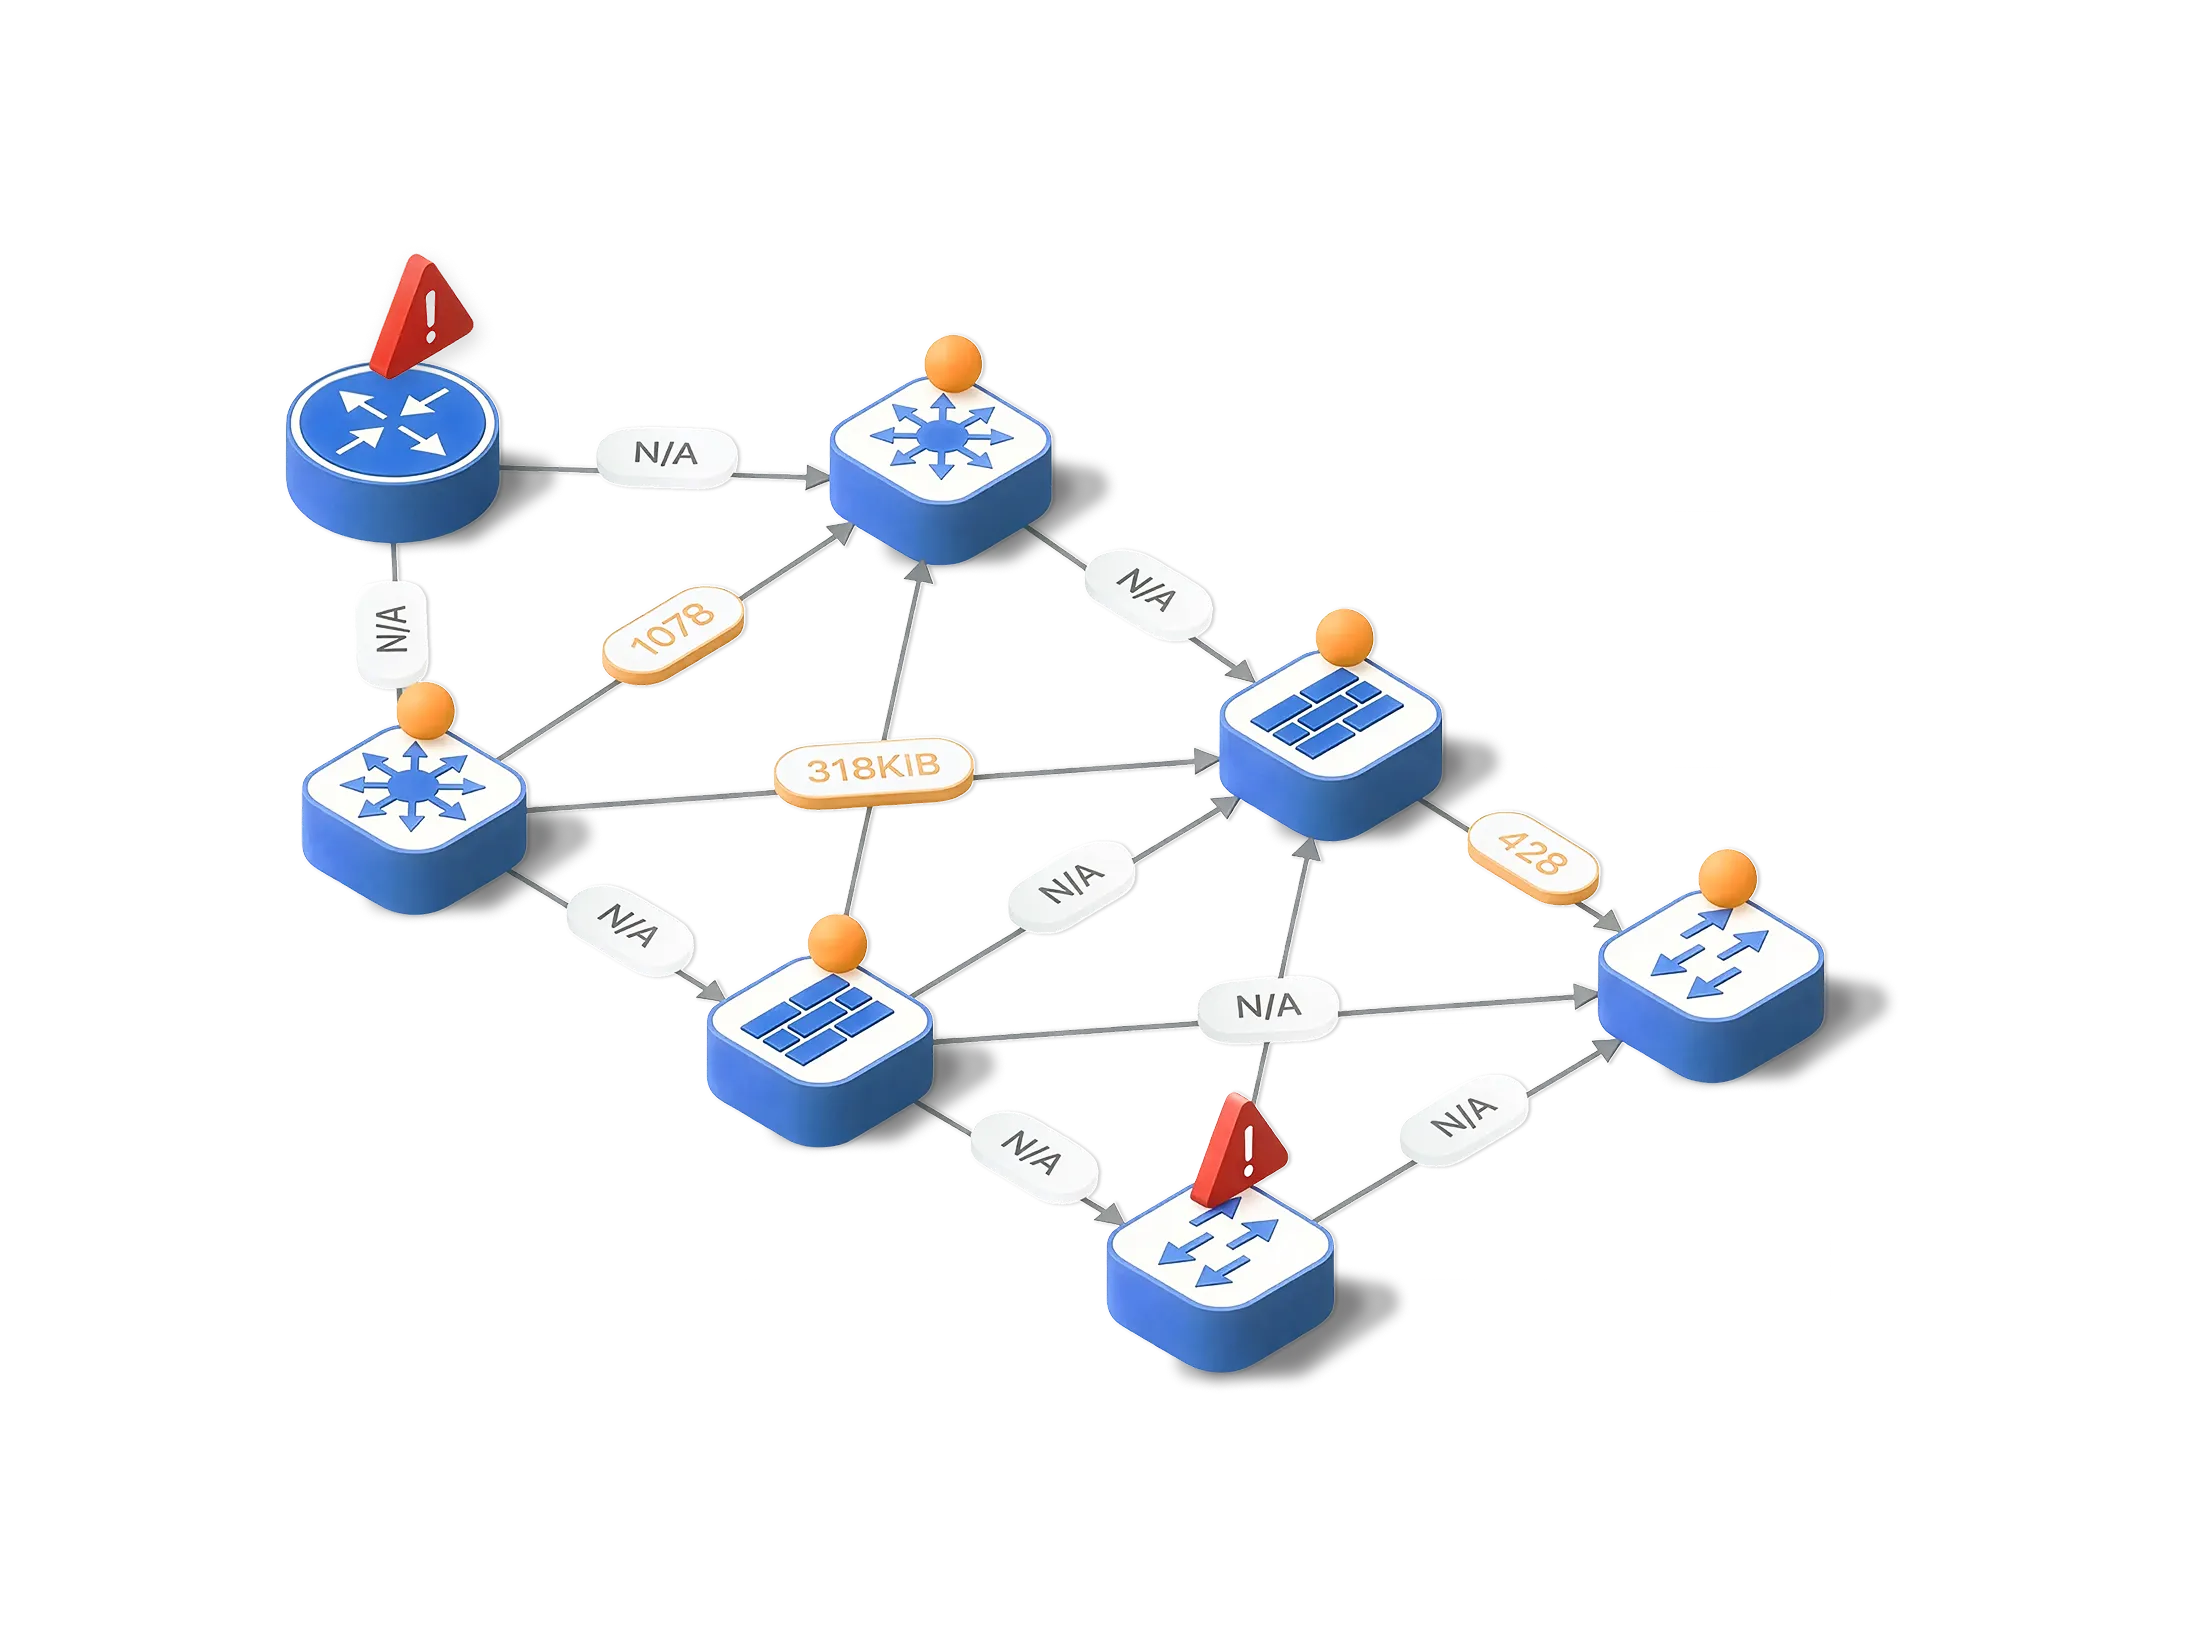
Device Failures Lead to Service Outages
Failures such as switch port errors, router CPU overload, or firewall session saturation can quickly escalate into full service disruptions.
Increasing Network Complexity
As cloud, hybrid, and multi-vendor environments expand, network operations become increasingly complex and difficult to manage.
Rising Operational Risk
Delayed incident detection, lack of capacity management, and limited visibility put service stability at risk.
WhaTap Network Monitoring (NMS)
WhaTap NMS is a SaaS-based solution that enables unified monitoring of diverse network devices with rapid deployment and automatic scalability—supporting stable and efficient operations.
Why WhaTap NMS?
Unified Monitoring on a Single Platform
Monitor application performance and network device status from one centralized platform. When issues occur, identify root causes quickly and respond across the entire system.
Multi-Vendor Support Based on Standard Protocols
Collect and manage data from diverse vendors using standard protocols such as SNMP, Syslog, and ICMP. New vendors and protocols can be added quickly and seamlessly.
Built-in MIB Browser and Management Tools
From complex OID analysis to onboarding new devices and configuring metrics, all tasks can be handled intuitively within WhaTap NMS.
Operational and Maintenance Efficiency
Engineer-optimized UI and integrated monitoring improve operational quality and enable real-time efficiency gains across monitoring and management workflows.
Key Features of WhaTap NMS
Network Data Collection
Collect and analyze device status and performance in real time using SNMP polling and traps, Syslog, and ICMP health checks. Detect anomalies and security-related events immediately to ensure network availability.
Flexible Metric Management
Define and extend metrics freely using a hierarchical naming structure. Once registered, metrics can be visualized instantly on dashboards for real-time monitoring, with views tailored by device or service.
Device-Level Monitoring
Visualize network devices to instantly check port and interface status, and analyze key performance metrics such as CPU, memory, and traffic in context. This enables faster detection of anomalies and supports stable, reliable operations.
Event-Driven Topology Map
Automatically discover and visualize network topology, adapting seamlessly to device additions and environmental changes. With drag-and-drop editing and real-time event correlation, teams can improve operational efficiency and accelerate incident response.
Top
Contact