.svg)
Share
Copied!


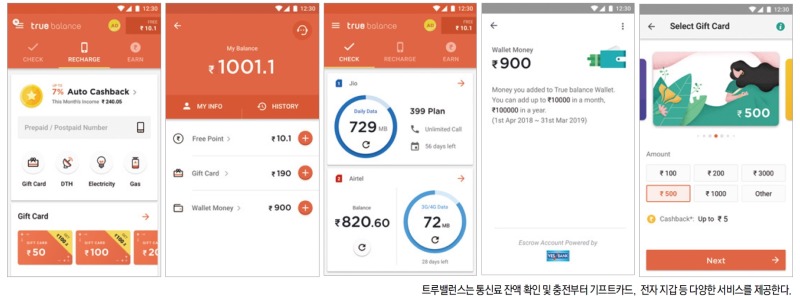
The fintech app True Balance—widely used across India, the world’s most populous country after China—is a platform that enables users to check and recharge their remaining mobile data and call minutes, with a strong focus on balance inquiries. In Southeast Asian markets such as India and the Philippines, where ARPU (Average Revenue Per User) is relatively low, prepaid billing remains the dominant model. Unlike the methods familiar in other countries, users in India check balances via “USSD.”
Because it is difficult to measure call and data usage in real time, users must dial or text a carrier-specific USSD code to receive a direct response containing their remaining balance. To eliminate this friction, True Balance developed a service that allows users to instantly view remaining call minutes and data volume.
The results were significant. Just one year after launch, the app surpassed 10 million downloads—one of the fastest growth trajectories among Indian fintech companies.
Balance Hero’s Jang Gil-soo, who participated in the interview, has been operating the service with WhaTap since its earliest days. His detailed feedback and insights into using WhaTap were particularly noteworthy. We met with Jang Gil-soo and Han Da-vit, responsible for database and server operations, to discuss how they manage and maintain service stability using WhaTap Monitoring.
Q. Please tell us about the state of your IT infrastructure.
Jang Gil-soo (hereafter Gil-soo):
Our entire infrastructure runs on AWS. Since we provide services in India, all major systems are deployed in the India region—there are no servers in Korea. Other than our DR setup, everything operates on AWS.
Q. What motivated you to adopt WhaTap?
Gil-soo:
We introduced WhaTap about five years ago, around the time the service itself was just getting started. We had no experience with other APM tools, and we wanted something lightweight and easy to begin with. Because WhaTap was still in an early stage, it was simple to install, and only essential features were shown without complex configuration. It fit our needs perfectly, and the WhaTap team provided very active support in the early days.
Q. How does WhaTap compare to other monitoring tools?
Gil-soo:
For database monitoring, WhaTap comes with all basic settings ready out of the box. Even without deep technical knowledge, you can simply install the agent, connect it to the DB, and most monitoring data is collected automatically. Essential graphs appear immediately through the web dashboard. In short, installation is easy and usage is simple.
With many other APMs, installation may be simple, but configuration is difficult—there are countless menus to set before getting meaningful data. When we first adopted WhaTap, I completed everything from installation to configuration and initial monitoring within 30 minutes to an hour, even without any prior experience.
Han David (hereafter David):
While I’ve used APM demos before, I haven't actively used other APMs in real environments—mainly because their setup processes were too complicated. Getting meaningful results required excessive configuration. I’ve been using WhaTap for 3–4 years now, and in the early days there were barely any configurations we needed to touch. Even though WhaTap has added more features recently, it’s still much more accessible compared to APMs from Company D or Company E.
Q. Which part of WhaTap do you check most often?
Gil-soo:
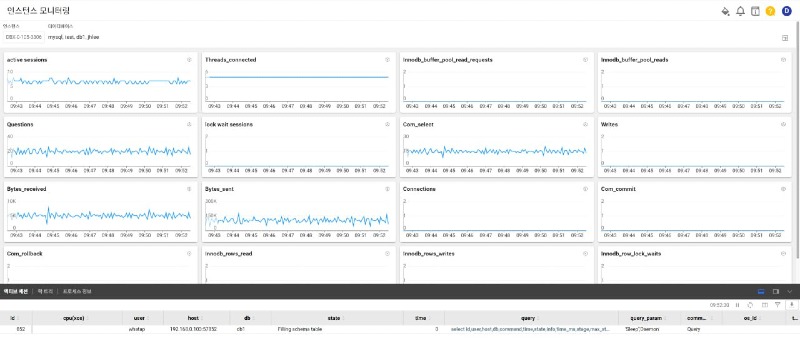
In DB monitoring, I frequently check the instance monitoring page, FlexBoard dashboards, and graph-based metrics. I also monitor active sessions in instance monitoring. The most common thing I watch is how queries are being processed in real time.
David:
I rely heavily on heatmaps in application monitoring. Once you get used to the heatmap patterns, it becomes easier to understand what type of issue is occurring. For example, if a continuous 3-second red line appears, it’s easy to identify where the related thread is stuck.
We also use cube analysis, which stores historical queue data. It becomes much easier to go back, review the patterns, and trace issues based on past data.
We recently started using server monitoring as well. Previously, we used Zabbix, but identifying which process used CPU or memory at a specific point in time wasn't easy. WhaTap server monitoring keeps historical resource data, so we can determine what CPU or memory usage looked like when an application was running. I monitor CPU and memory usage per process frequently.
Q. Have you resolved issues using WhaTap?
Gil-soo:
We rarely experience major failures these days. When issues occur, I frequently check instance monitoring. Other APMs often focus only on graphs, but WhaTap shows the executed queries alongside the graph when you click Total Runtime. If metrics unrelated to queries increase, you immediately know the problem lies elsewhere.
With XOS installed, we can also see process information, lock details, and DB-related data all on one page. If many slow queries appear or if locks occur due to changes, we can investigate the relationships instantly. I monitor continuously to catch early signs and act before small issues escalate into major outages. A DB failure is severe, so identifying early signals is critical.
Active transactions and heatmaps—especially for gateway processes central to the service—were extremely valuable. They helped me detect a major outage (complete service unavailability) before anyone else. Being able to identify which transactions were backing up, trace the cause, and resolve the issue was a huge advantage.
WhaTap also offers class-level transaction error statistics. In one partial-failure case, the developer hadn’t left any error logs, so we couldn't identify symptoms. However, WhaTap helped us identify them through its dashboards, leading us to the root cause.
Gil-soo:
For DB monitoring, I receive WhaTap warning alerts via Slack. Even without watching the monitoring dashboard, Slack notifications allow me to effectively monitor the system 24/7.
David:
I monitor application performance extensively—both system metrics and API errors. Since our service relies on third-party integrations in India, long outages there can cause timeouts on our end. We deploy almost every day, so I always watch the monitoring dashboard during deployment windows. Even when another engineer deploys, I continue to monitor. On average, I check the dashboard 3–4 hours a day. Slack alerts also help us respond instantly.
Frequently Used DB Monitoring Features
Frequently Used APM Features
Gil-soo:
Channel Talk support is excellent. Responses are detailed and immediate. If an issue remains unresolved, it is escalated directly to engineers via email—and the answers are thorough. Overall, the technical support has been outstanding.
Gil-soo:
For startups, I think WhaTap is absolutely worth trying. You might wonder which monitoring tool to choose, but instead of adopting a heavy and complex APM, I recommend WhaTap because it’s easy to start with, simple to use, and supported by a very friendly and responsive team. 😊

%201.svg)


.webp)


