.svg)
Share
Copied!


The offline academy sector was one of the fields most affected by the COVID-19 pandemic. However, some WhaTap customers were able to minimize this impact. Jeong JLS developed and has been operating an online learning service used by over 100,000 students across the country, and has continued to upgrade its services since migrating to the cloud in 2020. By using WhaTap, they detected errors before service deployments and reduced technical error inquiries by nearly 90% through continuous performance monitoring.
We met with CTO Shim Hyun-sik (hereafter Hyun-sik) and PM Lee Yun-jeong (hereafter Yun-jeong) to learn how Jeong JLS uses WhaTap for business growth, service stabilization, and incident response throughout their cloud transition.
Please introduce Jeong JLS and your organizational structure.
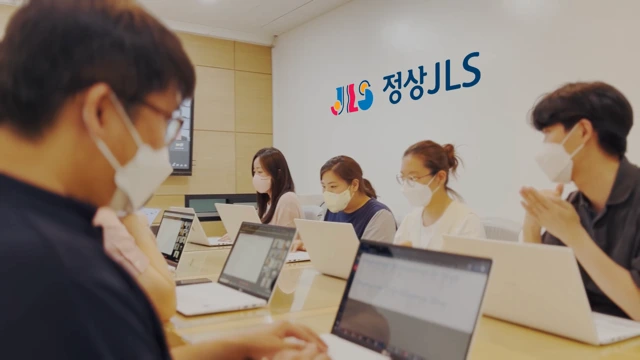
Yun-jeong: Jeong JLS’s most well-known brand is JLS Language School. We currently operate more than 130 directly managed centers and franchise locations nationwide. We also run an educational solutions business that supports after-school programs, kindergartens, municipal education centers, and overseas institutions by providing content and educational programs developed by JLS. Recently, we have expanded into video-based live education across a wide range of subjects—from early childhood to high school.
Please briefly describe your UX headquarters and IT infrastructure.
Yun-jeong: A total of 23 team members work across planning, design, operations, and development. Our headquarters oversees everything from content creation to platform development.
Hyun-sik: Our infrastructure currently runs on AWS. When we first migrated from IDC to the cloud, we optimized and refactored the existing infrastructure. As our architecture continues to evolve, we are improving it toward a fully cloud-aligned serverless environment.
What led you to choose WhaTap?
Hyun-sik: When we migrated from IDC to the cloud in early 2020, we urgently needed monitoring for service stability—but didn’t have an internal system in place. We started with open-source monitoring to learn the basics, but quickly hit limitations. While searching for a more reliable solution, we discovered WhaTap.
WhaTap’s SaaS-based model, with continuous feature updates and usage-based pricing, was a good fit. But the biggest reason we chose it was the engineer who handled the demo. Unlike other vendors who simply introduced their product, he analyzed our environment and proposed how we could use WhaTap most effectively. That left a strong impression.
Yun-jeong: Another reason was WhaTap’s UX. In our organization, UX is one of the most important factors in development. Regardless of how powerful the features are, if the interface is difficult, adoption becomes impossible. WhaTap demonstrated that even developer-focused tools can deliver an intuitive and friendly UX, and the confidence of the presenter made us trust the product.
Which features do you use most in application monitoring?
Hyun-sik: We check heatmaps frequently. The development and QA teams review anomalies first and then analyze how often they occur and what improvements are needed using reports, statistics, and transaction search.
Yun-jeong: I also focus on error monitoring through heatmaps. WhaTap allows you to visually identify what matters most. The recently updated heatmap pop-up view allows us to compare multiple heatmap sections simultaneously, which makes it even more convenient.
How do you use database monitoring?
Yun-jeong: Mainly to improve data processing performance. After moving to the cloud during the pandemic, we experienced a sudden surge in usage when offline classes were suspended. Because the academy model concentrates transactions at specific times, slow queries started to surface quickly.
With WhaTap database monitoring, we identified problematic queries and optimized them. This significantly improved performance during peak usage periods.
What specific problems has WhaTap helped you solve?
Hyun-sik: WhaTap has been a tremendous help during QA. Many issues don’t appear in pre-deployment QA but surface only after live deployment. For every new feature, we run intensive monitoring with WhaTap for at least a week. This allows us to catch unexpected cases early and optimize before users encounter problems.
Yun-jeong: Customer service inquiries have dropped dramatically since adopting WhaTap. Previously, around 90% of technical inquiries were due to service errors. Now, almost no error-related inquiries occur—only occasional questions related to device environments.
Would you recommend WhaTap to other companies?
Hyun-sik: Absolutely. There’s hardly anything to hesitate about.
To deliver competitive services, companies must understand customer needs and maximize user experience. We use WhaTap proactively even during development and QA. Every QA scenario is validated through WhaTap metrics, helping us prevent issues before deployment and improve usability. For organizations that value user experience, WhaTap is extremely helpful.
You use AWS. How does WhaTap complement Amazon CloudWatch?
Hyun-sik: The biggest advantage is true integrated monitoring—something we couldn’t get from open-source or on-prem tools. WhaTap’s integration with CloudWatch allows us to view infrastructure and applications together. With the FlexBoard, we can see everything on a single screen without switching between tools. Given how busy our environment is, this unified visibility is extremely valuable.
How would you summarize WhaTap monitoring in one phrase?
Yun-jeong: I would call it a “customer discomfort alert system.”
WhaTap intuitively surfaces issues that customers may experience. It makes it easy to identify whether a specific process is slow or whether something is failing. Since everything—from infrastructure to applications—can be checked with a single tap, the origin of a problem is immediately clear. Not only is root-cause identification faster, but resolution time has also improved significantly.

%201.svg)


.webp)


