.svg)
Share
Copied!


Web novels have surged in popularity in recent years, with countless platforms now hosting serialized stories. Among them, MUNPIA is recognized as a place where aspiring writers build their careers. Because the platform serializes virtually every genre and attracts a large user base, maintaining service stability is essential.
MUNPIA reports that it has significantly improved service stability by using nearly all of WhaTap’s monitoring products. We spoke with CTO Lee Sang-min to learn how WhaTap is being used across their environment.
Q. Please introduce MUNPIA and what it does.
MUNPIA began as “Go! Moorim,” a web novel community centered around martial arts fiction. It was a space where writers shared and critiqued each other’s work. As more genres emerged, the platform evolved, and when the company was incorporated in 2013, it became MUNPIA—a platform now covering more than 21 genres. It has been just over 10 years since incorporation.
There are few platforms where writers can serialize freely, and MUNPIA positions itself as a place where anyone who wants to write can grow into a web novel author. You might even call it a “career portal” for writers (laughter). Today, thousands of writers publish on MUNPIA each year.
Q. Can you share your current infrastructure setup?
While I can’t share detailed architecture, I can say that our services are fully cloud-based.

Q. Have you used other monitoring tools before?
Yes. I’ve used a wide range of monitoring solutions—open source, commercial products, and virtually everything available on the market.
Q. Then why did you choose WhaTap?
I tend to view software as a living organism. Starting with CTO Kim Sung-jo, I saw that WhaTap continuously evolves and improves so that the “organism” can grow. That gave me confidence. I also appreciated how passionate the team was about applying technical improvements and reflecting customer feedback.
Q. What WhaTap services are you currently using?
We use application monitoring, server monitoring, browser monitoring, URL monitoring, and database monitoring—essentially almost every monitoring service WhaTap offers.
Q. Why did you introduce Browser Monitoring after joining MUNPIA?
I wanted to enhance user experience and service quality. My goal was for developers to see real user-side response times and UI performance, analyze them directly, and use those insights to evolve the MUNPIA service.
When we first introduced browser monitoring, the heatmap looked like a tsunami. Today, it’s calm and blue—like a still lake. Watching the service stabilize visually over time has been incredibly rewarding.
Q. How well are employees using WhaTap monitoring?
I believe our team understands and uses WhaTap at a 70% or higher proficiency level.
The purpose of monitoring is to quickly identify problematic services or projects and take action. When I joined, the first thing I did was separate projects. If multiple services are grouped together, it’s difficult to pinpoint where an issue originates. After separating and visualizing services clearly, locating issues became much faster.
Another reason for high adoption is that WhaTap engineers provide tailored, on-site training and are highly responsive to online inquiries.

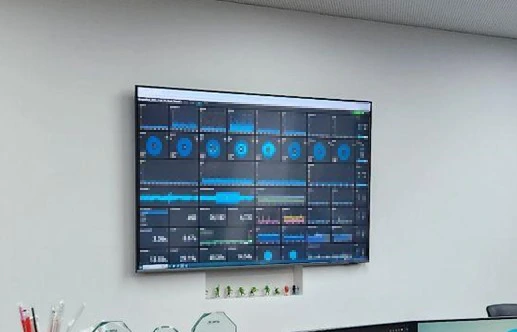
I use WhaTap extensively (laughter), and I resolve about 95% of our issues with it. Its notification features make it easy to detect failures first, identify where they occurred, and resolve them quickly. In most cases, WhaTap alone is sufficient. I also keep the main dashboard open on our office monitor at all times for immediate visibility.
Q. Which WhaTap features do you use most?
I primarily use heatmaps and transaction maps—the core features of application monitoring. Among the most valuable tools are SQL and error statistics. The SQL feature can even surface table-level details, which helps us estimate usage capacity. I also rely heavily on analytics and chart-based metrics.
In browser monitoring, heatmaps are incredibly useful. They allow us to trace the root cause of issues, identify abnormal users through client IP analysis, and view problems from multiple angles—one of WhaTap’s biggest strengths.
Q. You seem to be using WhaTap very effectively. Do you have tips for others?
I’ll share a personal tip—one that might “make your boss love you” (laughter): Use the FlexBoard well.
“A well-made FlexBoard can beat any single-column dashboard.”
Monitoring is all about seeing everything at a glance. A well-constructed FlexBoard is extremely powerful, and using honeycomb charts is a particularly effective way to build one.
Q. Why do you recommend WhaTap to companies considering monitoring?
Companies adopt monitoring for different reasons. If you’re considering a foreign solution, think about whether an engineer in a different time zone can truly support you when critical issues occur—and whether anyone can physically visit your company to help. WhaTap’s customer support is exceptional by comparison.
Ultimately, the right product depends on your monitoring goals. Since WhaTap quickly identifies root causes and provides thorough support, I strongly recommend it for companies that need fast, accurate root-cause analysis during incidents.
Q. You introduced WhaTap while creating an online course. Why is that?
WhaTap is the only domestic integrated monitoring platform that offers complete performance visibility. When they believe a feature is necessary, they implement it quickly—and it’s clear the company is committed to ongoing development. Because of that, I trust the platform and feel comfortable recommending it.
Q. Can you tell us about the course and why you recommend WhaTap?
I wanted to compile all my performance knowledge into one place. After weighing the volume and overlap with my previously published books, I decided an online course would be the best format for knowledge transfer.
The course covers everything from understanding performance fundamentals to selecting tools, diagnosing bottlenecks, testing methods, and hands-on troubleshooting. It covers performance engineering topics such as Java GC, development considerations, troubleshooting approaches, and service performance diagnostics.
This course may not benefit students who are just beginning their studies, but it will be extremely helpful for developers or infrastructure engineers with at least one year of experience. I especially recommend it to managers who need to discuss performance with developers.


%201.svg)


.webp)


