WhaTap GPU Monitoring: 5 Differentiators and Key Capabilities
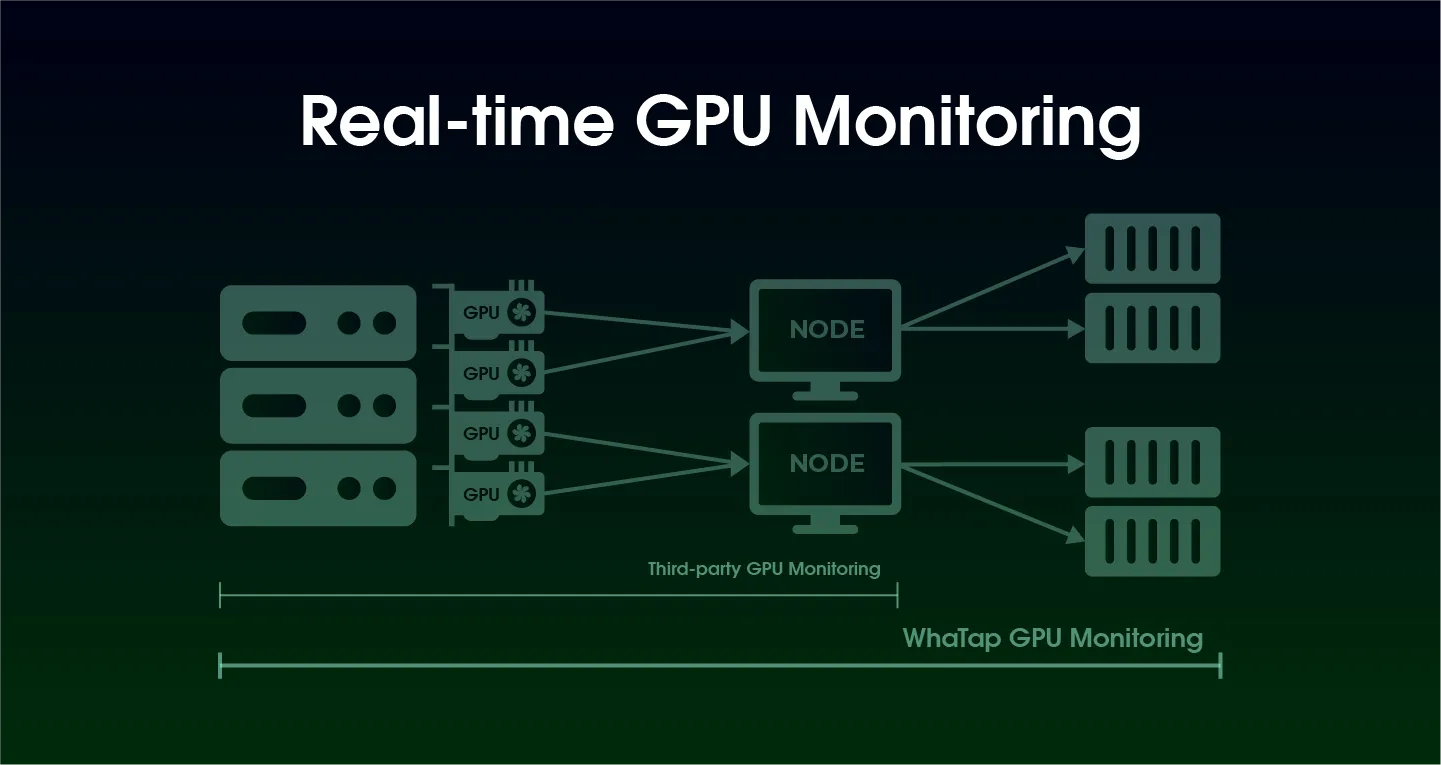
Is your GPU working hard right now?
Do you remember visiting Yongsan Electronics Mall to buy 32MB or 64MB of RAM? As Gordon Moore once predicted, hardware performance has advanced exponentially for decades. CPU, memory, and disk performance has dramatically improved, and with the recent drop in hardware prices overall, companies often find their computing power exceeding actual needs.
Since the emergence of ChatGPT, we’ve realized that technological progress is accelerating faster than ever. AI-related news dominates global tech discussions, and many companies are developing AI-driven services or embedding AI into existing products.
In this AI era, GPUs have become essential infrastructure—but because they are significantly more expensive than traditional hardware, the need for efficient utilization policies and specialized operational tools has grown rapidly.
To address these needs, WhaTap has introduced GPU monitoring capabilities for both infrastructure and Kubernetes environments. With this, customers can check in real time whether their expensive GPUs are being fully utilized and whether issues are occurring.
Of course, Kubernetes platforms and some GPU allocation tools provide basic visibility.
However, what makes WhaTap’s specialized GPU monitoring different?
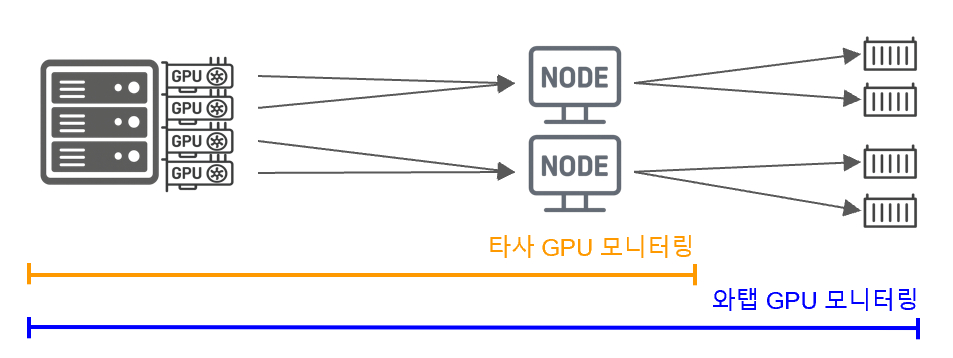
1. Purpose-built architecture that reflects how GPU farms operate
When large GPU farms are managed and allocated to teams or users, a dedicated resource management system becomes essential.
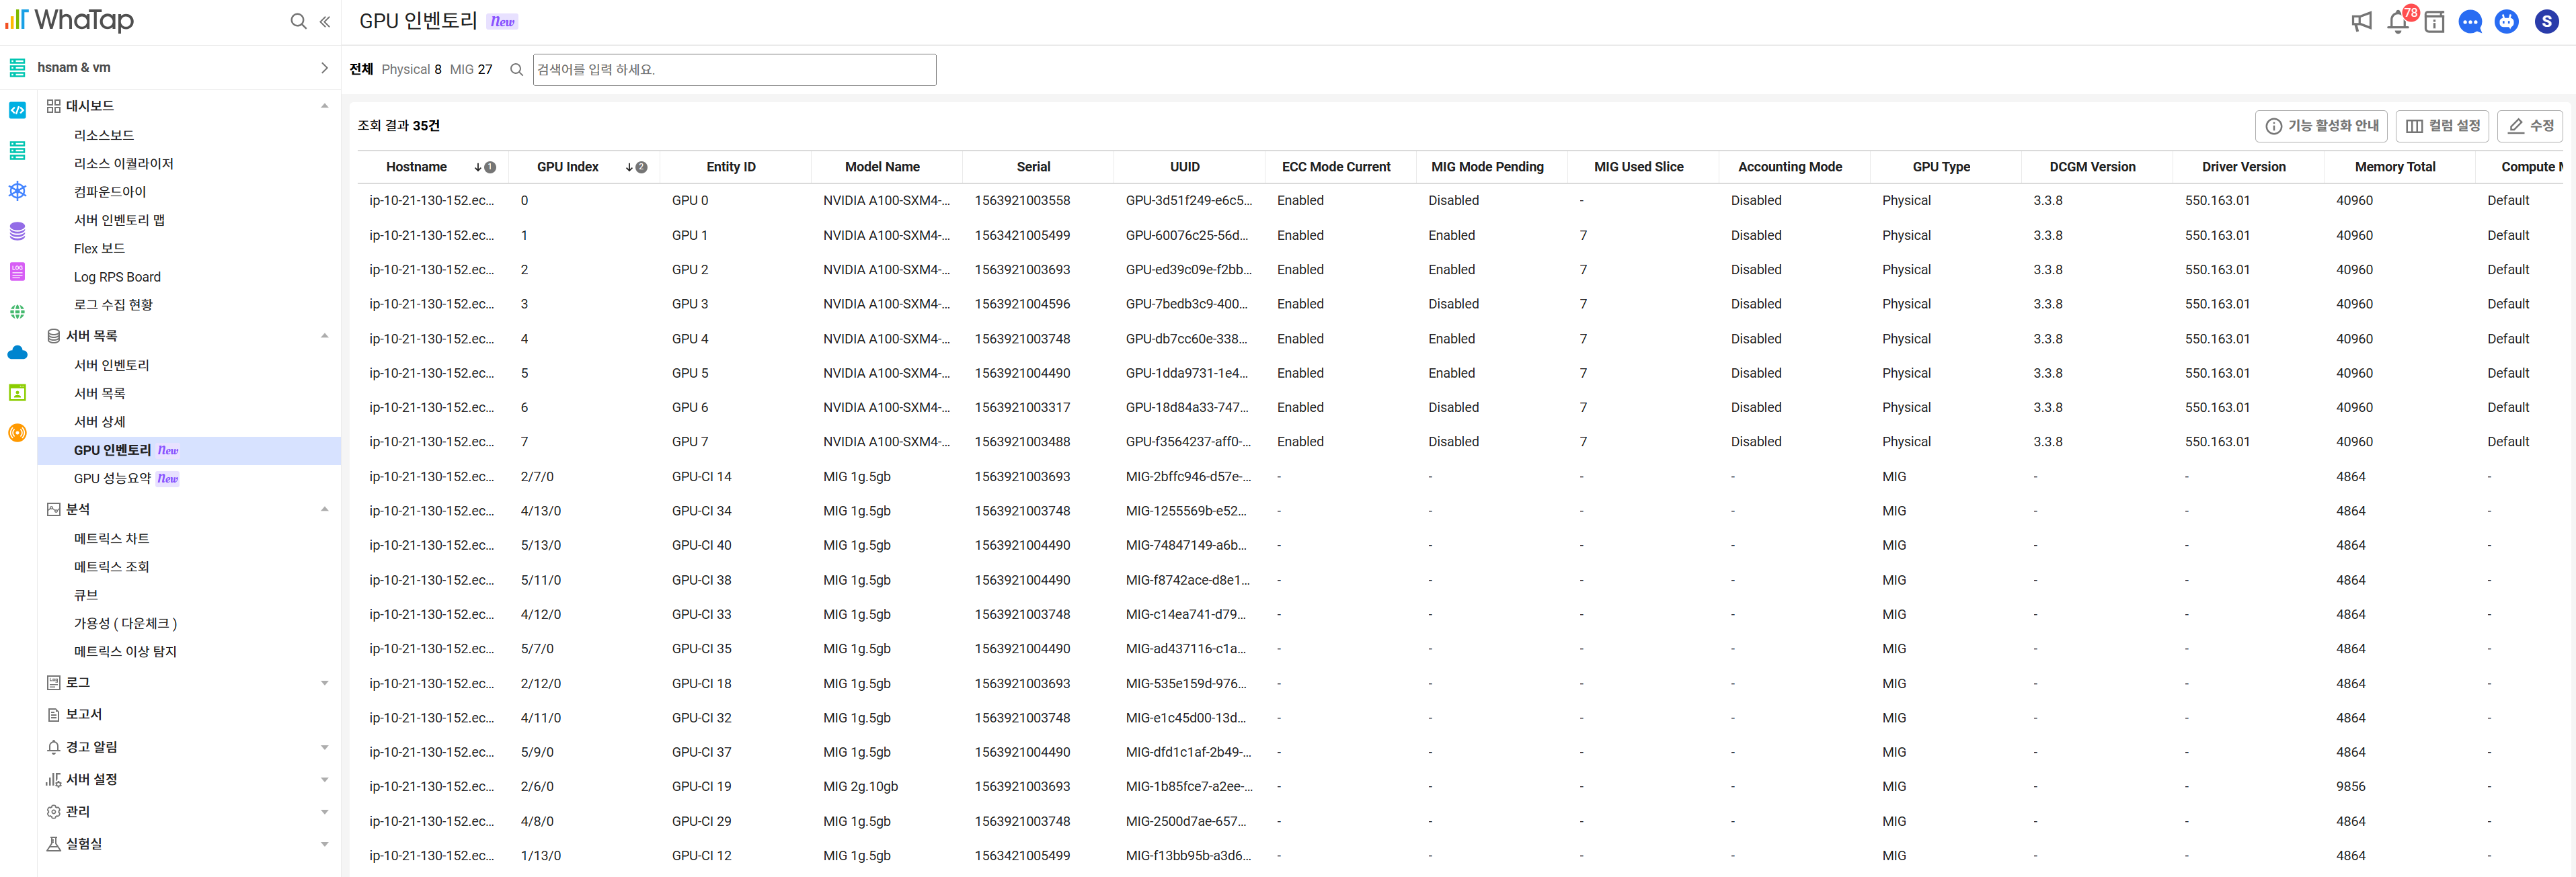
WhaTap’s Server Monitoring provides a GPU inventory view that allows you to check:
- Status and health of all GPUs (including MIG instances)
- Usage by team/project
- GPU filtering for troubleshooting or maintenance
All at a single glance.
When used alongside Kubernetes monitoring, inventory data becomes even more powerful.
💡 Multi-Instance GPU (MIG): A technology that splits a single GPU into multiple isolated GPU instances so multiple workloads can run simultaneously.
2. Fast visibility into device-level status across large GPU clusters
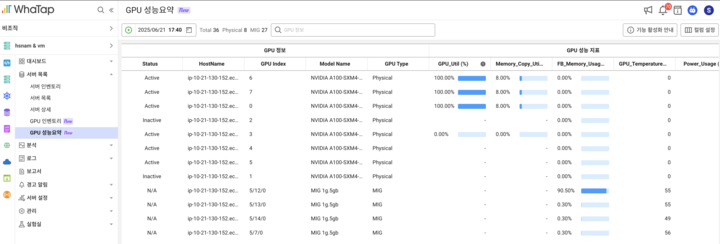
To reduce cost and ensure availability, operators need to identify GPU utilization gaps, bottlenecks, and load-heavy workloads.
WhaTap Server Monitoring fully supports MIG environments and provides real-time metrics that allow teams to immediately identify issues and optimize resource allocation.
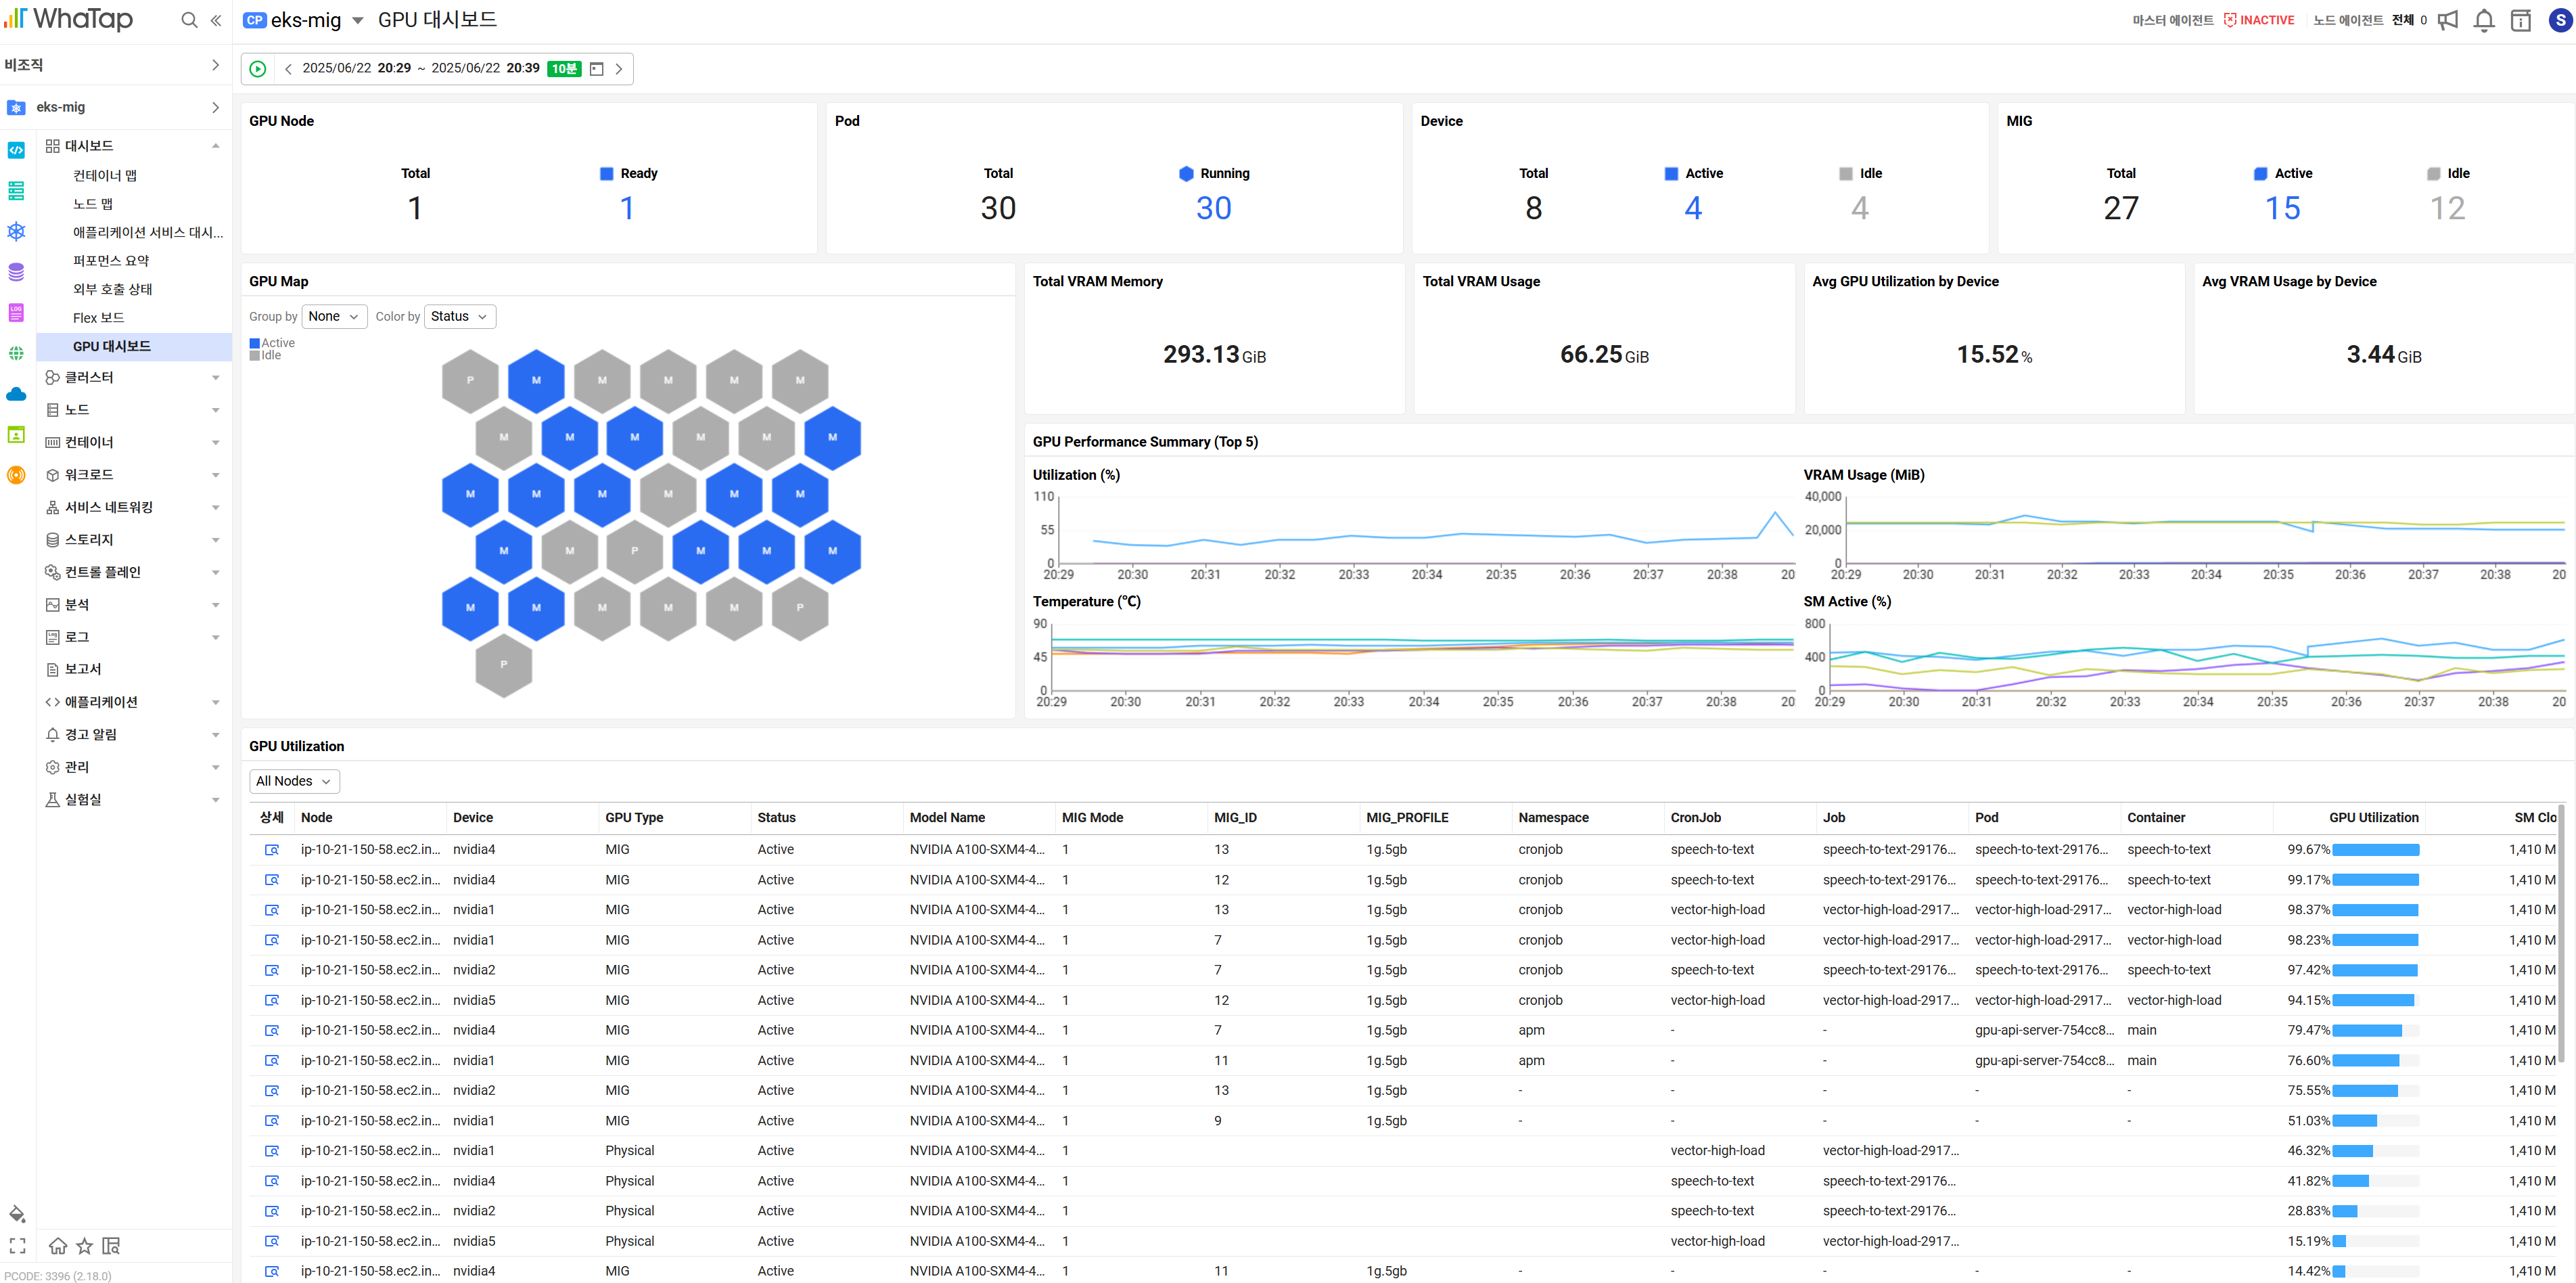
3. A visual dashboard that shows all GPU resources at a glance
The GPU dashboard offers unified visual insights across nodes, pods, and assigned GPUs (including MIG). On the GPU map screen, you can instantly check GPU status and usage, and even drill down into the applications consuming those resources.
4. End-to-end analysis across infrastructure and applications
WhaTap helps teams track root causes quickly without checking dozens of different metrics manually.
Rather than providing isolated numbers, WhaTap analyzes the entire stack—from hardware to applications.
For example:
- The Container Map visualizes containers based on GPU usage.
- When combined with APM, you can trace performance all the way up to the application layer.
This ensures a complete, connected analysis path.
![[쿠버네티스 모니터링] 컨테이너맵](https://cdn.prod.website-files.com/683542e0144e8b6bf7a76d7b/68a5798f4c3e9132070f6c7b_6874b21ad8f6d82664cb5791_6873aa632941e0ce6223f96d_image%2525204.png)
5. Correlation analysis with the metrics you choose
NVIDIA GPUs output a wide range of metrics. While key data such as GPU utilization and memory usage are included in the default dashboard, each organization has different priorities.
With Matrix Explorer, you can select and visualize only the metrics you need and identify correlations quickly.
![[서버 모니터링] 매트릭스 익스플로러](https://cdn.prod.website-files.com/683542e0144e8b6bf7a76d7b/68a5798f4c3e9132070f6c74_6874b21ad8f6d82664cb578b_6873aab05da735d72bc5392d_image%2525205.png)
Conclusion
Just as single servers began to be split into virtual machines through cloud and hypervisor technologies, GPUs are now being logically divided using MIG. To utilize GPU resources effectively, you need precise data and clear visibility into how they’re used.
WhaTap will continue enhancing its GPU monitoring and analysis features to ensure customers maximize the value of their GPU investments.
We hope WhaTap GPU Monitoring helps you operate GPU resources more efficiently—with full visibility and confidence.
.svg)
%201.svg)


%201.svg)
.webp)
.webp)
