Why is GPU monitoring essential?
Real-time insights into GPU health and usage are just as vital as GPU adoption itself.
Effective workload management begins with knowing how your GPUs are performing.
Effective workload management begins with knowing how your GPUs are performing.

AI Boom → Surge in GPU Demand
As AI adoption accelerates, GPU prices are rising while supply remains limited. To maximize ROI, you must reduce waste and increase utilization.

Increasing Operational Complexity
From MIG and Kubernetes to pods and jobs, GPU environments are becoming harder to manage. Real-time observability is critical to maintain control.

Service Reliability at Stake
GPU performance issues directly impact end-user experience. Proactive monitoring is no longer optional. It's essential.
WhaTap GPU Monitoring
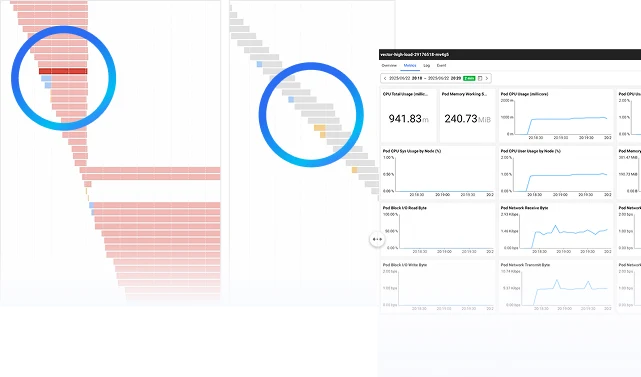
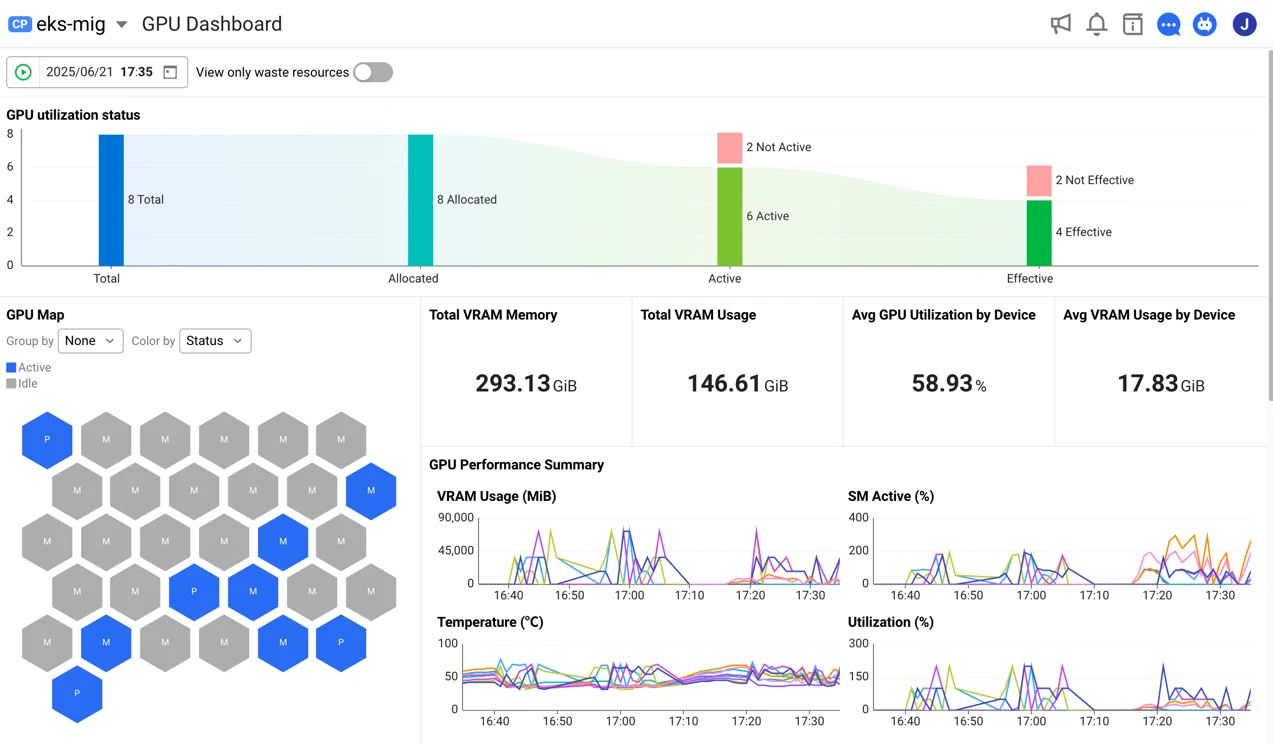
WhaTap visualizes GPU usage and performance across your infrastructure.
Drill-down graphs help you quickly identify underutilized or idle resources, ensuring nothing goes to waste.
Drill-down graphs help you quickly identify underutilized or idle resources, ensuring nothing goes to waste.
What Makes WhaTap Different
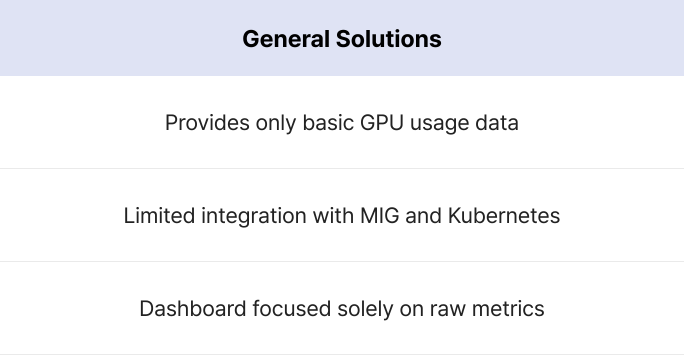
WhaTap provides full-stack observability, from node and GPU to MIG instances and applications, all within a single unified view.
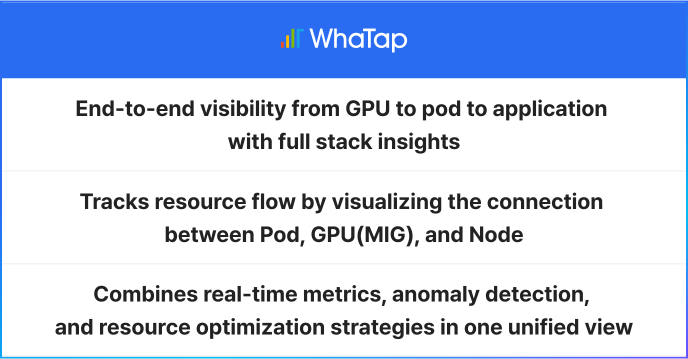
Key Features of WhaTap GPU Monitoring
From resource inventory to real time analytics, WhaTap offers everything you need to operate GPUs efficiently.
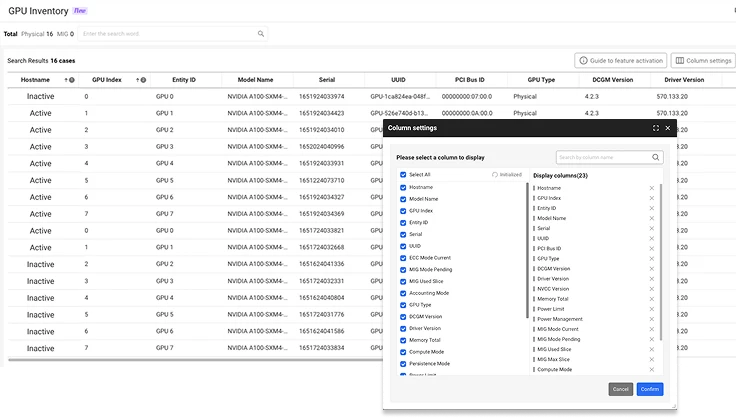
GPU Inventory
Automatically collects key details such as model, specs, and more for each server's GPU. Custom fields enable flexible tagging and management based on your internal context.
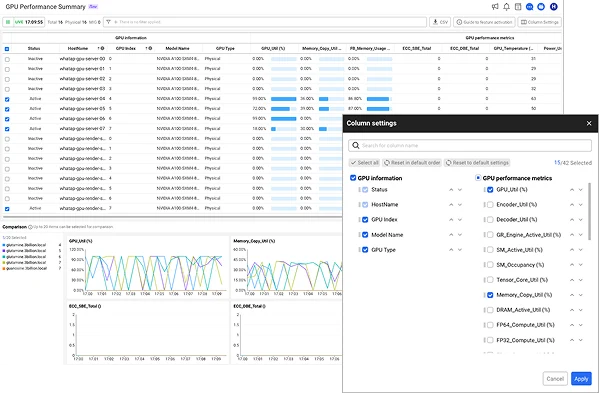
GPU Performance Summary
Track active status and usage metrics in real time or at any past point in time across multiple GPUs.
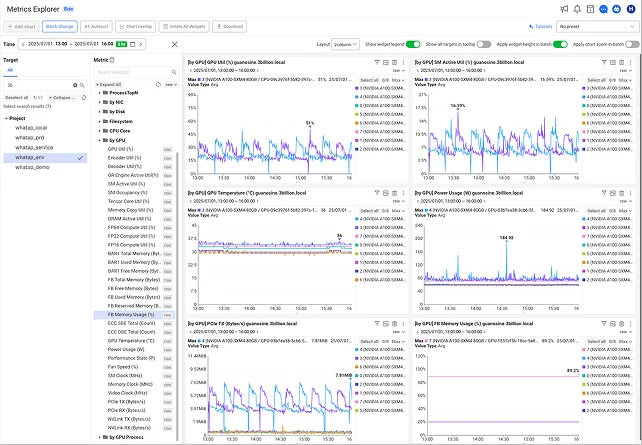
Metrics Explorer
Analyze deep-dive GPU metrics with WhaTap's dedicated Metrics Explorer for detailed performance investigations.
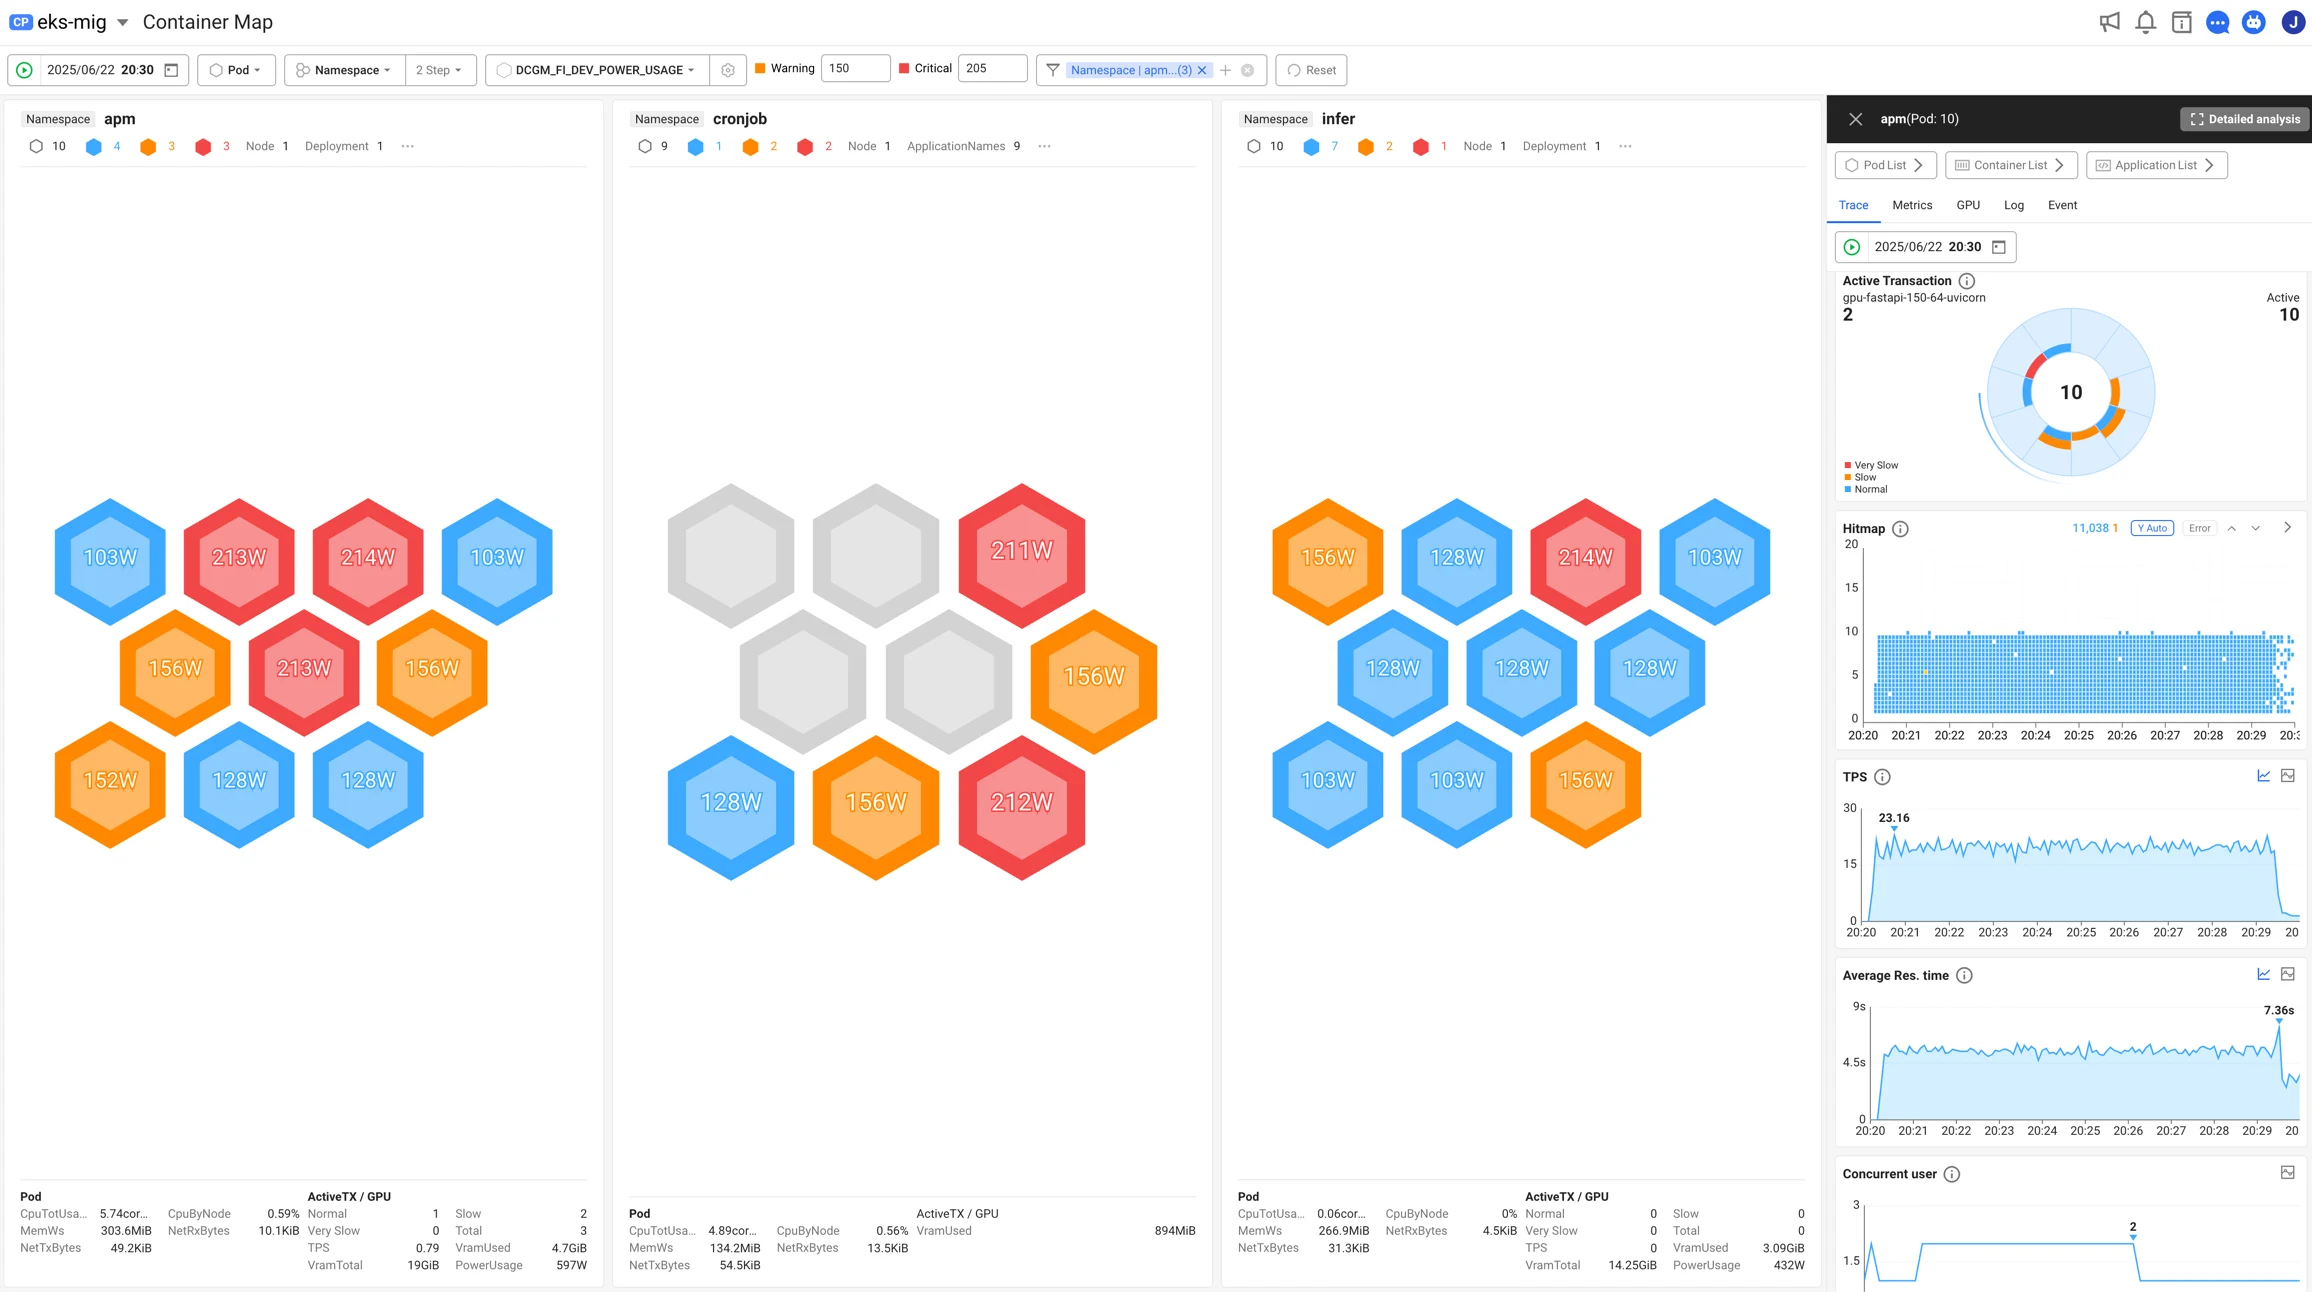
Kubernetes Correlation
WhaTap correlates GPU infrastructure with Kubernetes workloads. See how resources are allocated from GPU to Pod to application—all in one place.
Efficiency Insights
Understand how GPU resources are distributed across Pods and Jobs at any given moment. Identify idle capacity and improve GPU utilization with data-driven insights.