WhaTap Database Monitoring can check the performance metrics for open source databases and Cloud databases as key indicators.
Database Insight
Unique features of the WhaTap database
Supports various databases
You can monitor everything from open source databases to Cloud databases such as Redis, MongoDB, and RDS.
Flexible installation to suit your environment
Monitoring is possible without any installation on the DB server because it has a flexible structure that allows you to select a location of the collection agent to suit your environment.
Correlation analysis for applications, servers, and logs
You can check the SQLs and logs for applications, servers, and databases to trace the causes more quickly and accurately.
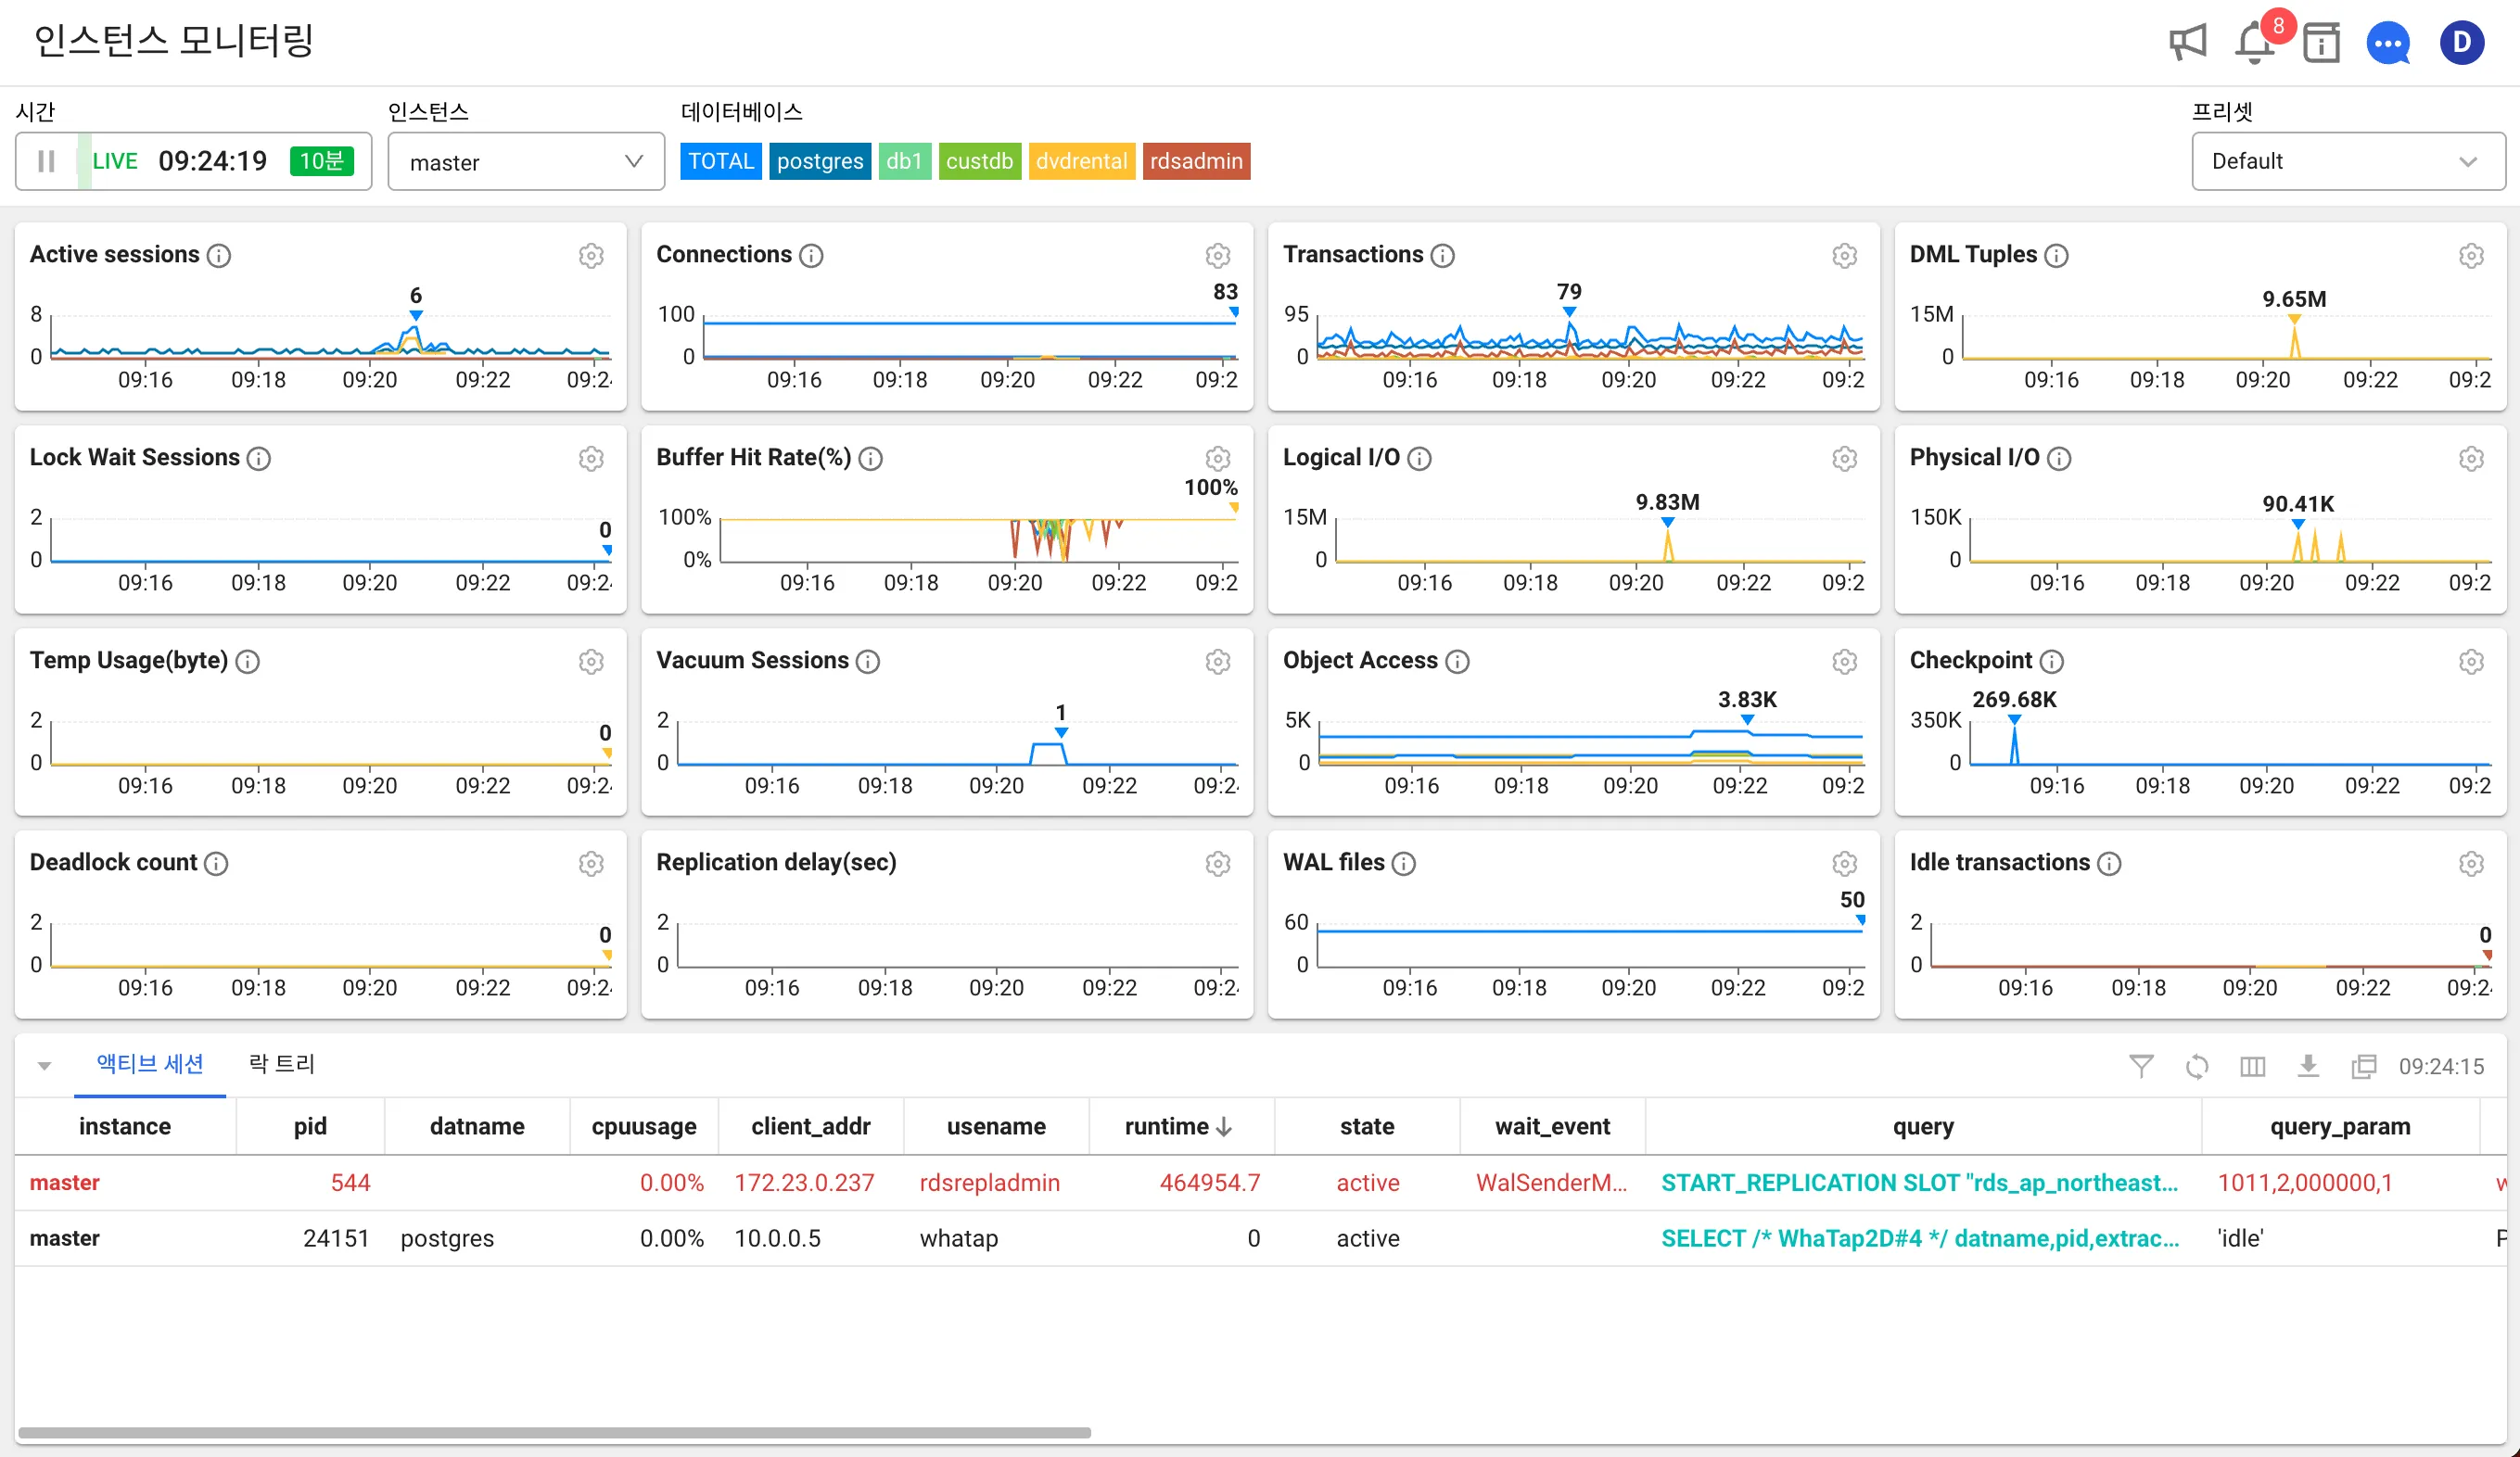
Analysis of performance data in seconds
With the performance data collected every second, you can check the operational trends for key database metrics in real time and trace the performance data.
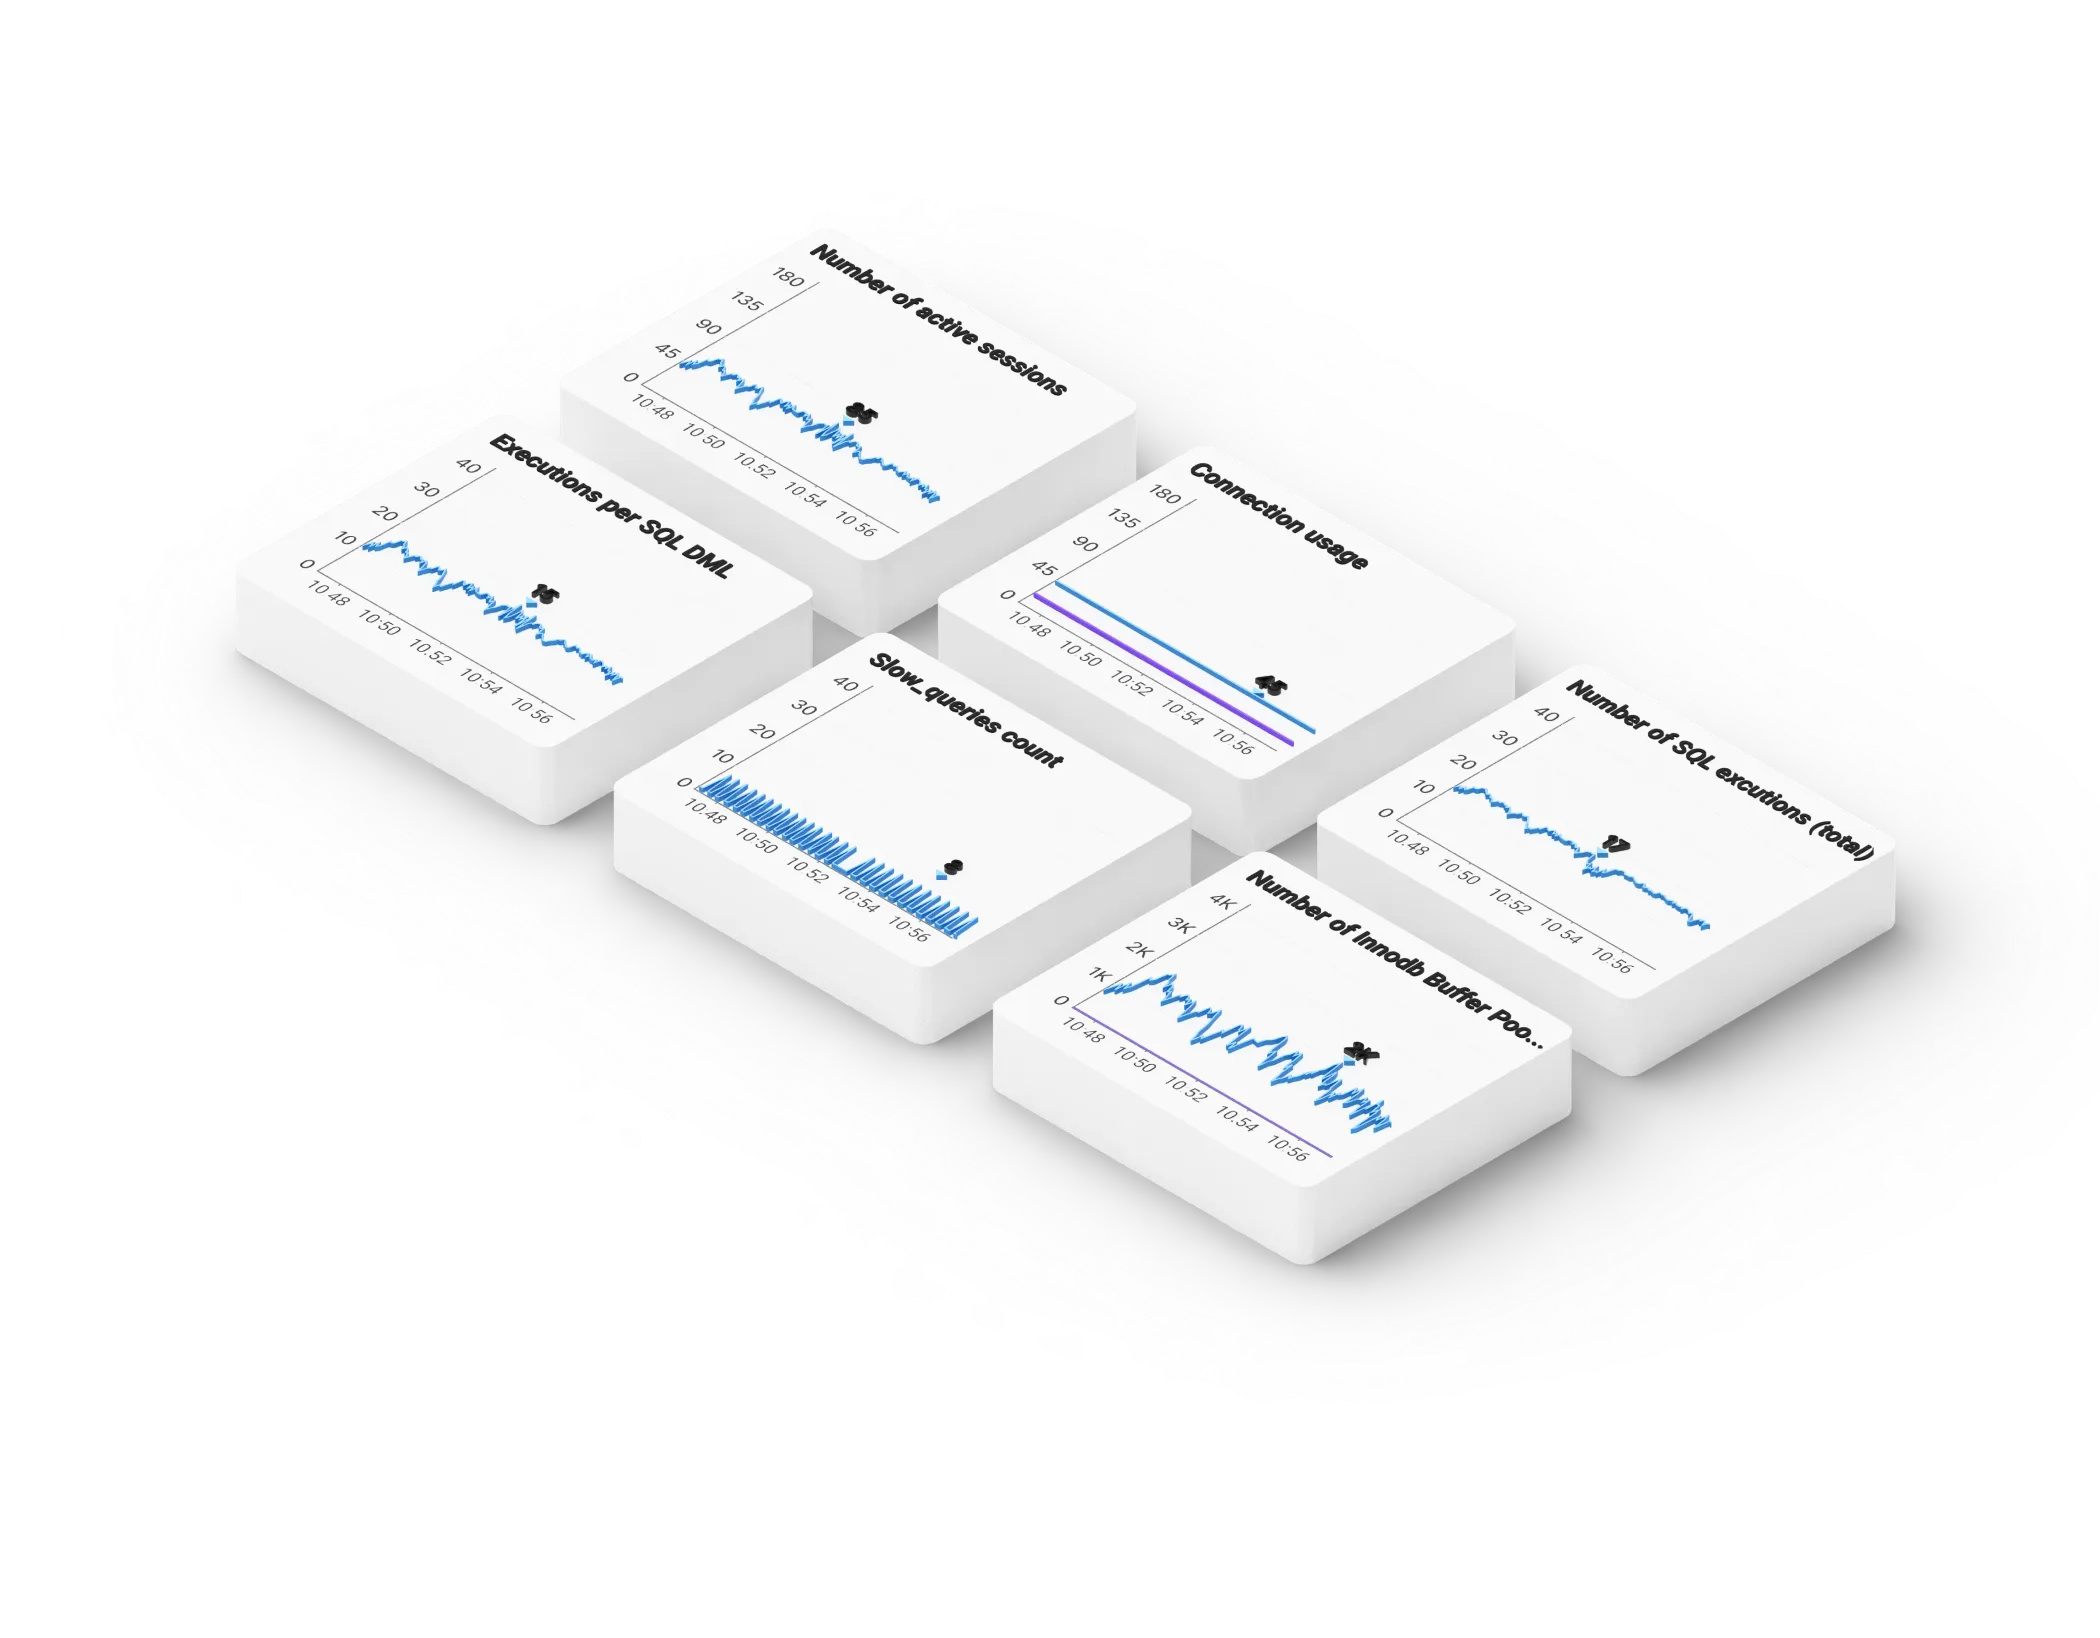
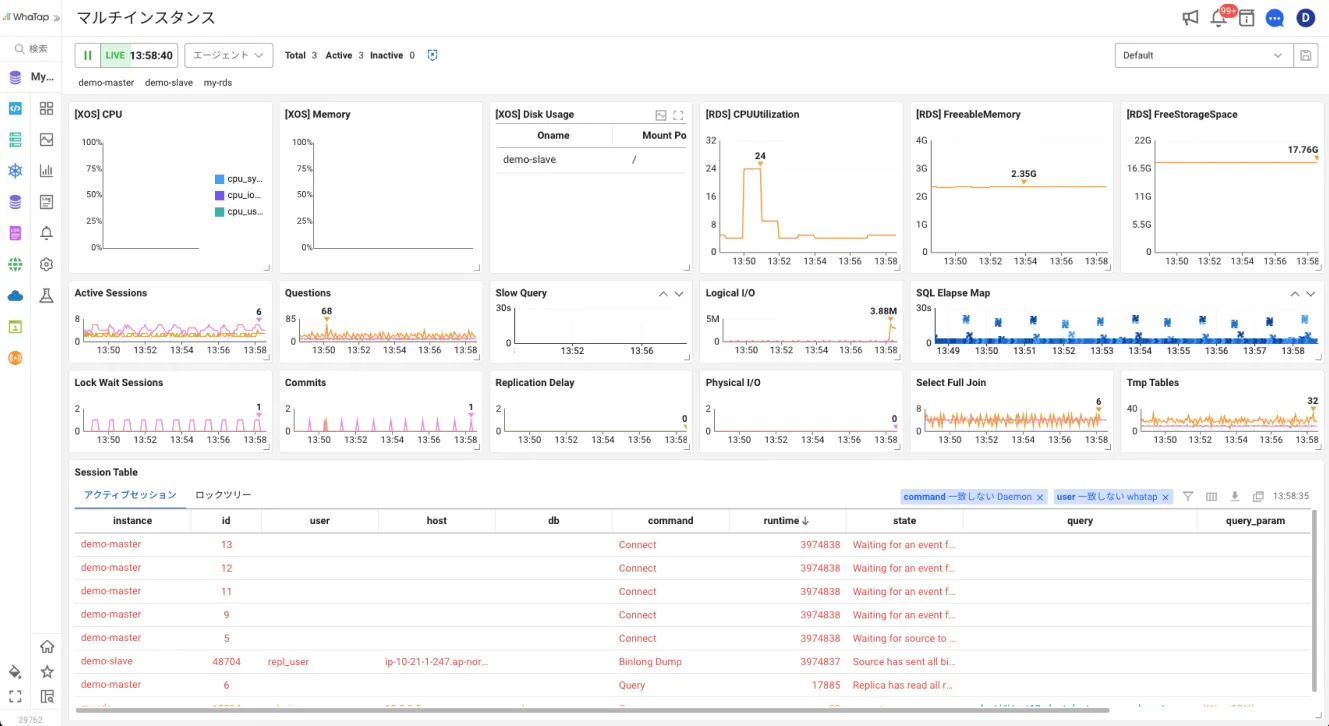
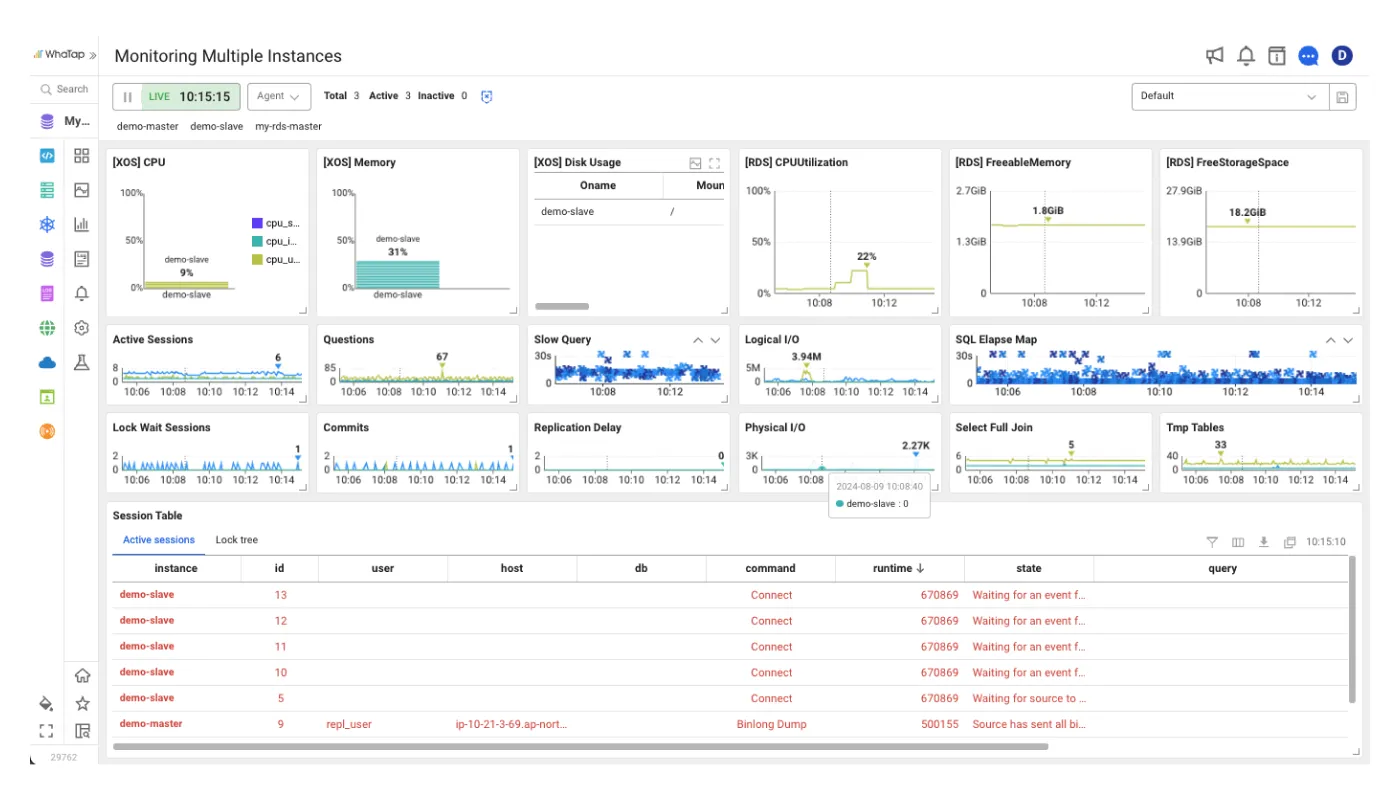
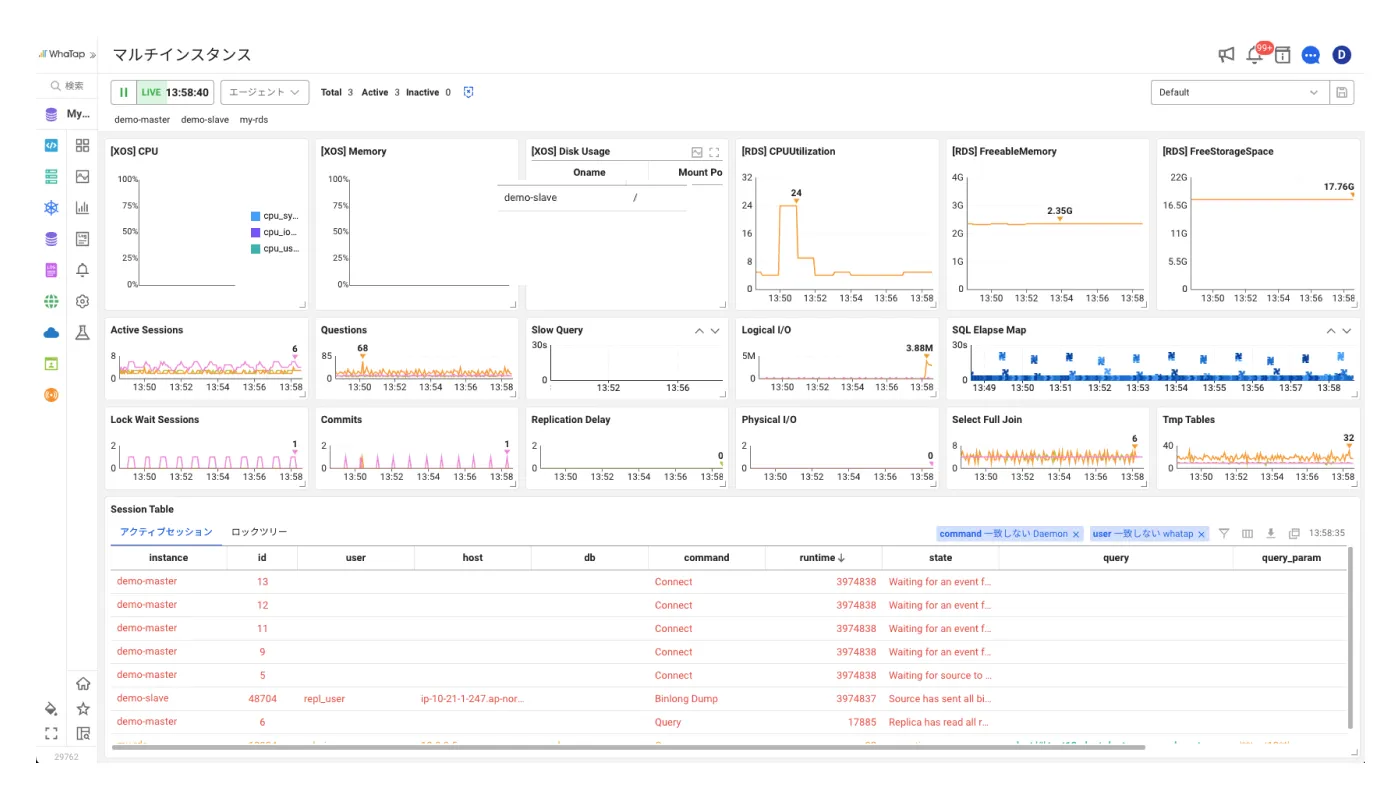
Multiple Instance Monitoring
You can check the status of multiple databases on one screen, and configure dashboards for key metrics in the preset and custom formats.
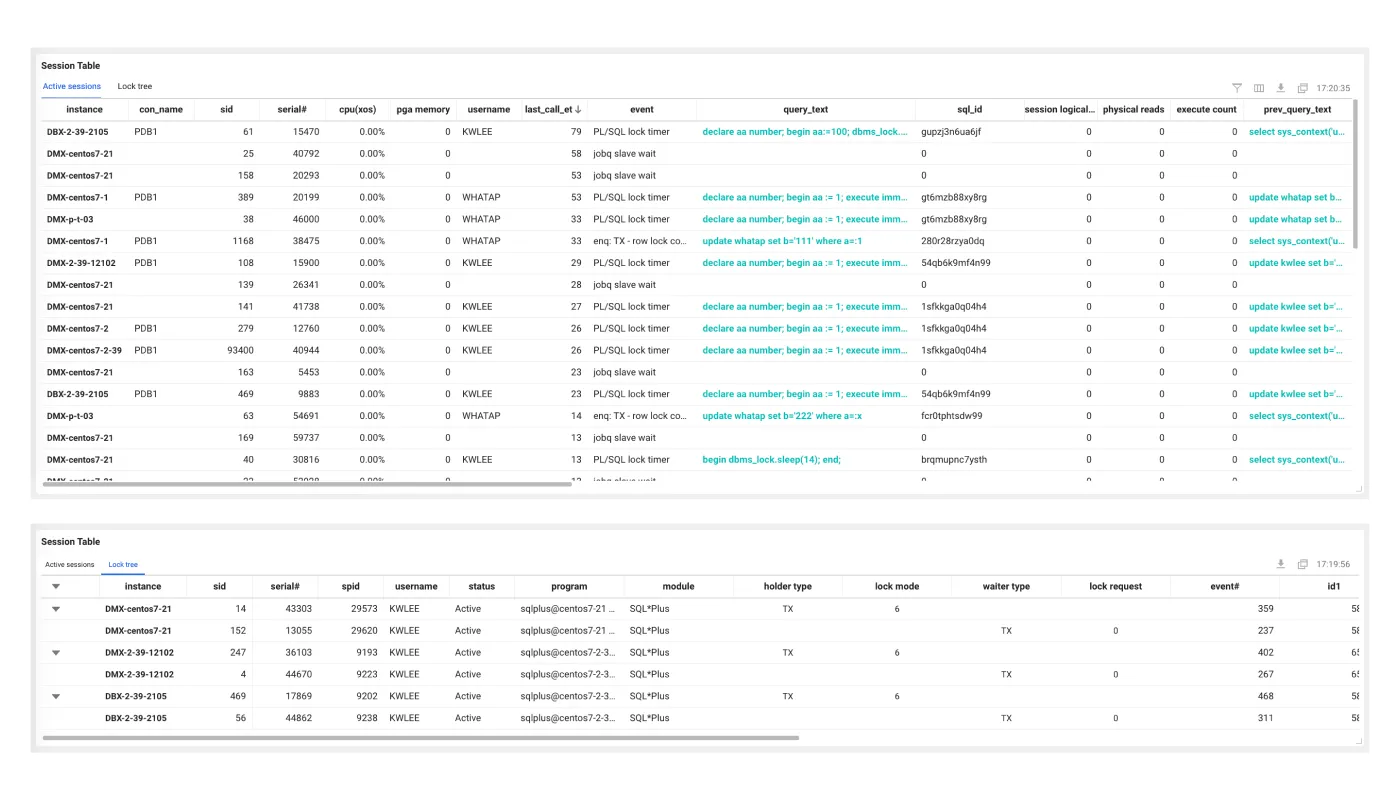
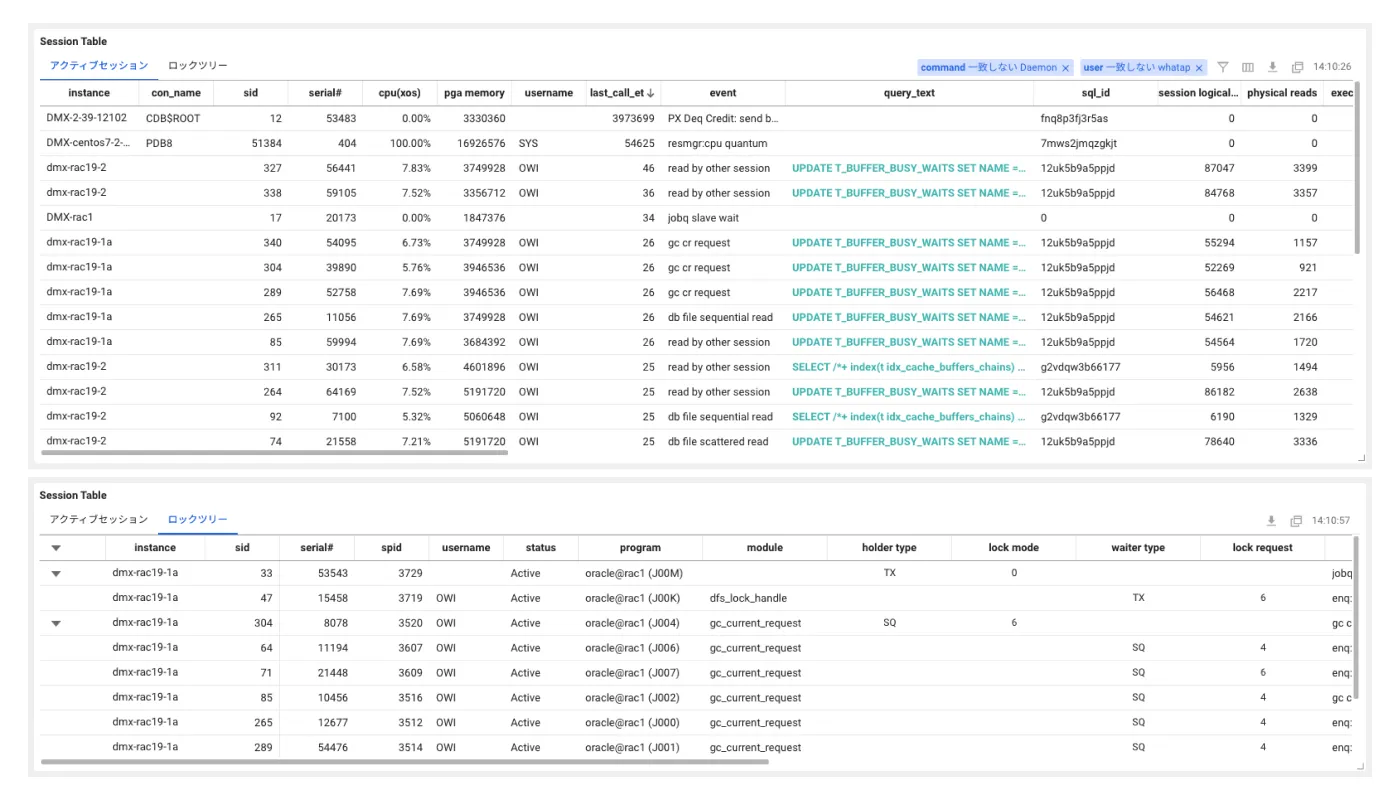
List of real-time sessions
You can check the queries and locks that are being performed on the database in real time, and perform post-analysis by using the saved data.
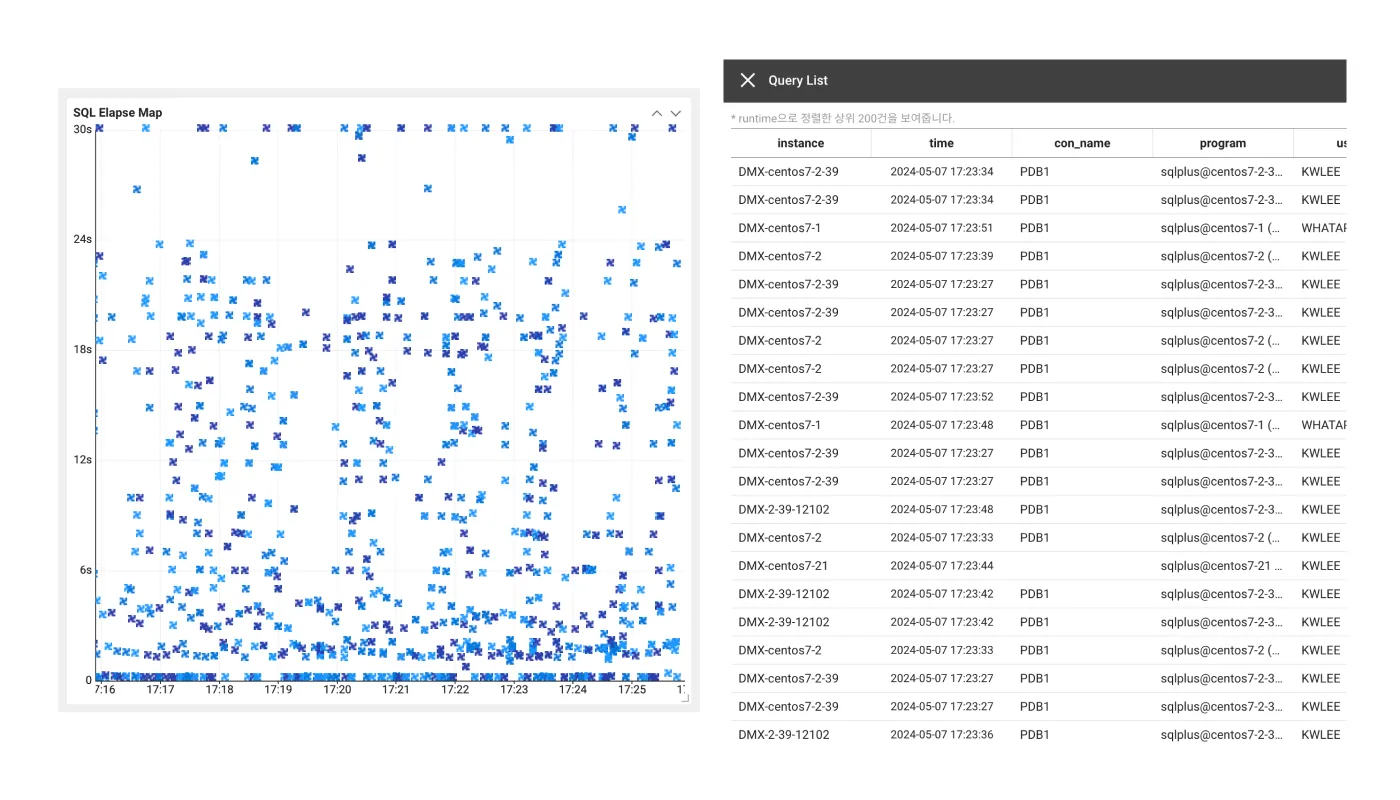
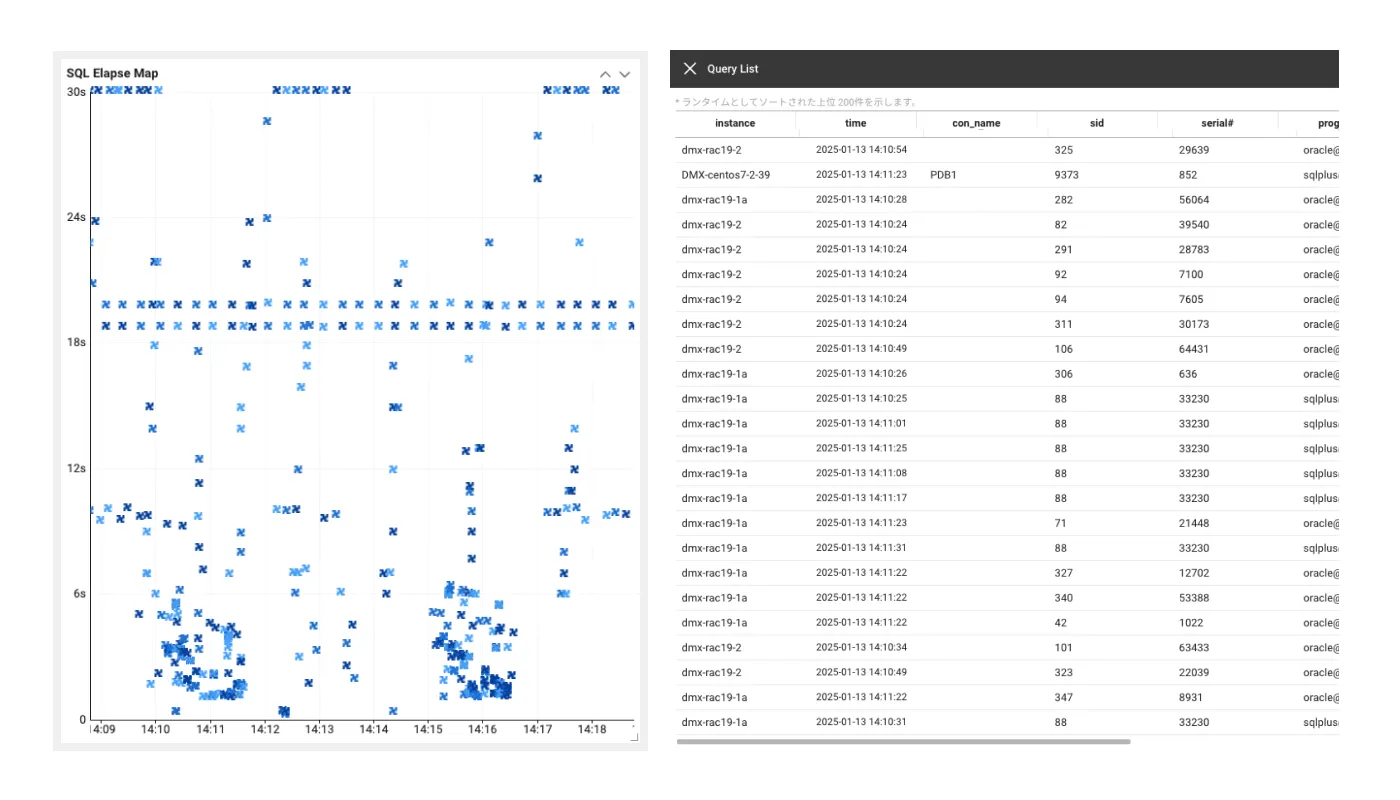
SQL Elapse Map
By visually displaying the end times of queries in the database on a chart, you can see the database status and also analyze slow queries.
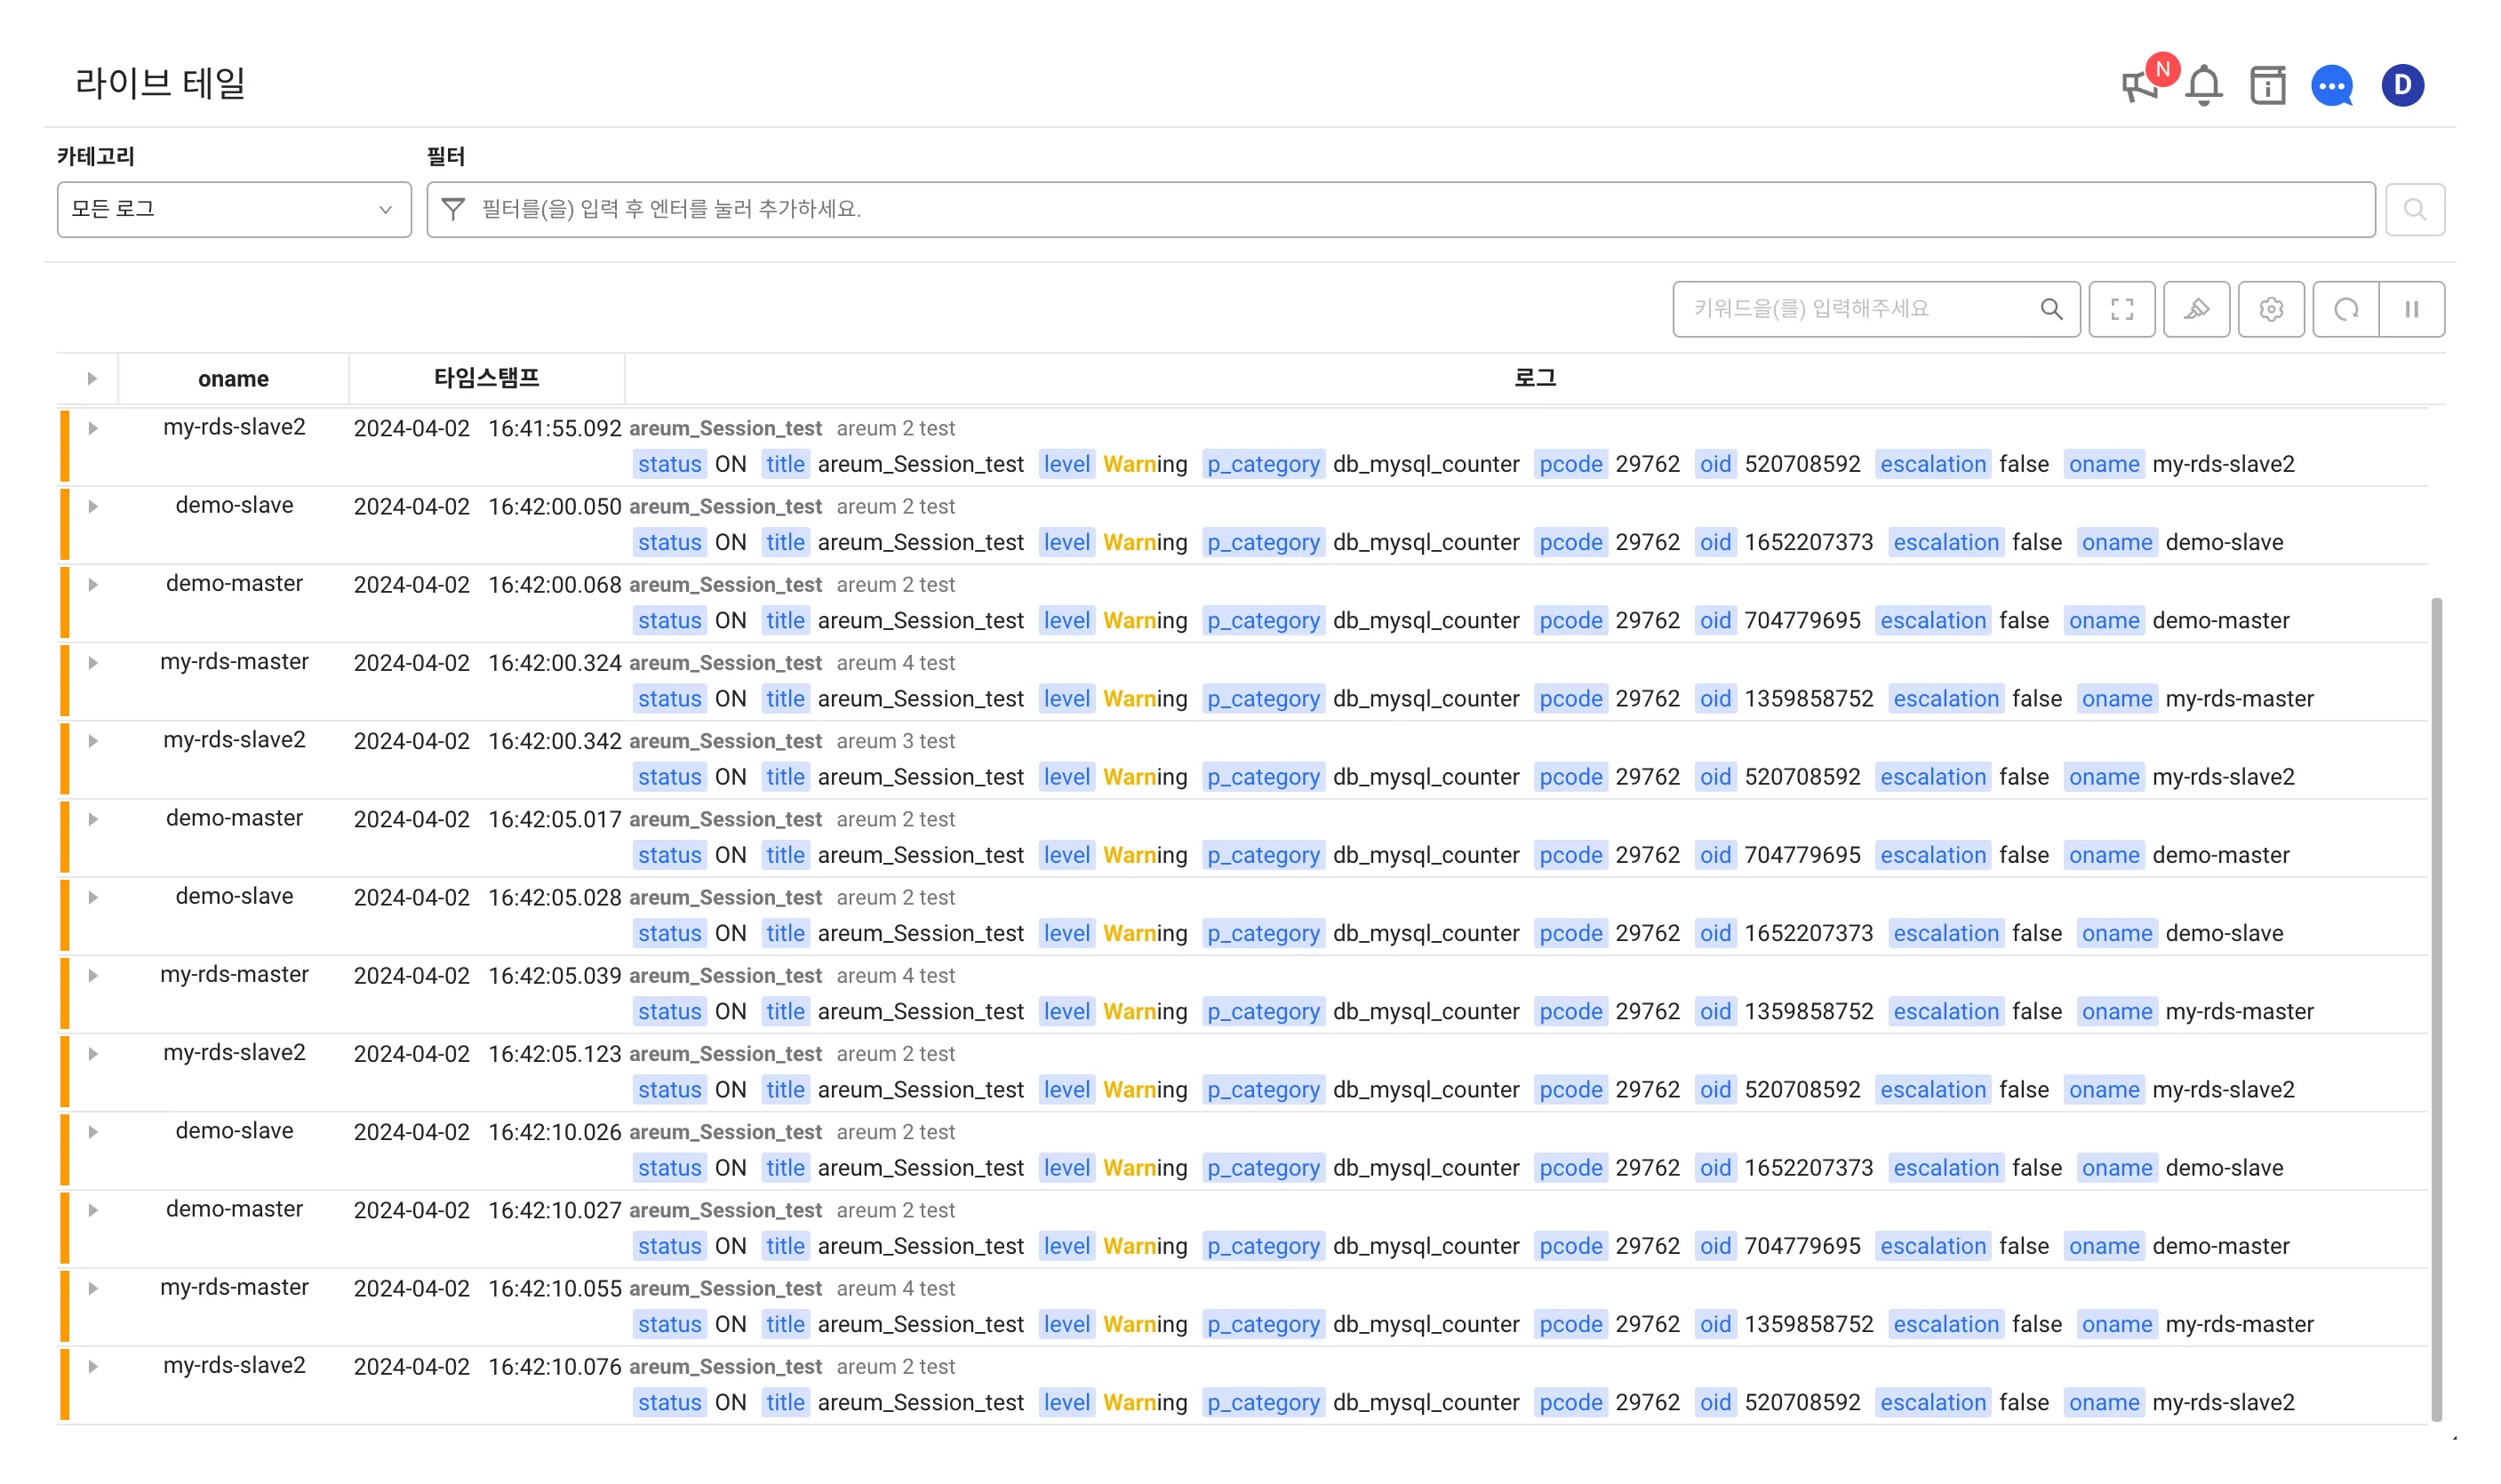
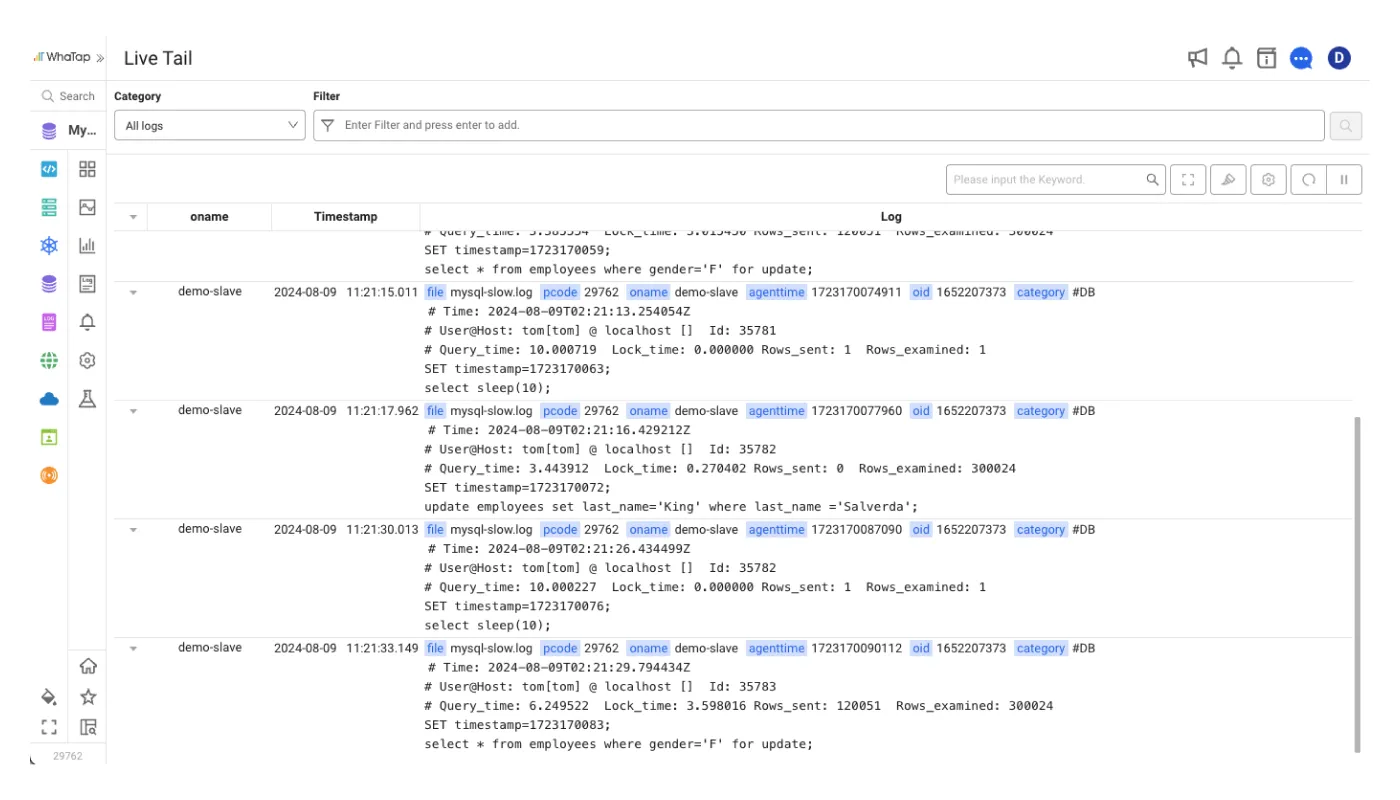
Integrated database log monitoring
The logs and event records for installed databases and Cloud and open source databases can be checked at a glance with Live Tail and Log Search.
.svg)


%201.svg)
.svg)


