🎤 WhaTap x ilert Live Webinar | May 6 (Wed)
Top
Contact
Simplify network management. Smarter operations
Network Monitoring
Ensure visibility and stability across network infrastructure
using standard protocols like SNMP, Syslog, and ICMP.
Why Do You Need NMS?
The network is the physical foundation of your services. Without proper visibility,
issues cannot be prevented—and stable operations become impossible.
Device Failures Lead to Service Outages
Failures such as switch port errors, router CPU overload, or firewall session saturation can quickly escalate into full service disruptions.
Increasing Network Complexity
As cloud, hybrid, and multi-vendor environments expand, network operations become increasingly complex and difficult to manage.
Rising Operational Risk
Delayed incident detection, lack of capacity management, and limited visibility put service stability at risk.
일부 사용자만 겪는 p99 지연은 보이지 않습니다. 호출 맥락이 사라지면 재현조차 불가능합니다.
멀티모델·인프라 운영 복잡성
LLM 서비스는 여러 모델, 여러 API, GPU 인프라, 쿠버네티스 환경과 운영되는 경우가 많습니다. 이때 자원 상태를 따로 보면 원인 파악이 늦어질 수 있습니다.
WhaTap Network Monitoring (NMS)
WhaTap NMS is a SaaS-based solution that enables unified monitoring of diverse network devices with rapid deployment and automatic scalability—supporting stable and efficient operations.
와탭 LLM Observability는 다릅니다
와탭은 LLM 애플리케이션부터 GPU 인프라, 쿠버네티스 Pod, 그리고 호출 트레이스까지 전 구간을 아우르는 통합 인사이트를 제공합니다.
호출 맥락 전체를
단일 트레이스로 보존
시스템 메시지·프롬프트·도구 호출까지 모든 입력을 원본 그대로 저장하여, 장애 즉시 재현이 가능합니다.
성능과 비용을 함께
보는 운영 관점
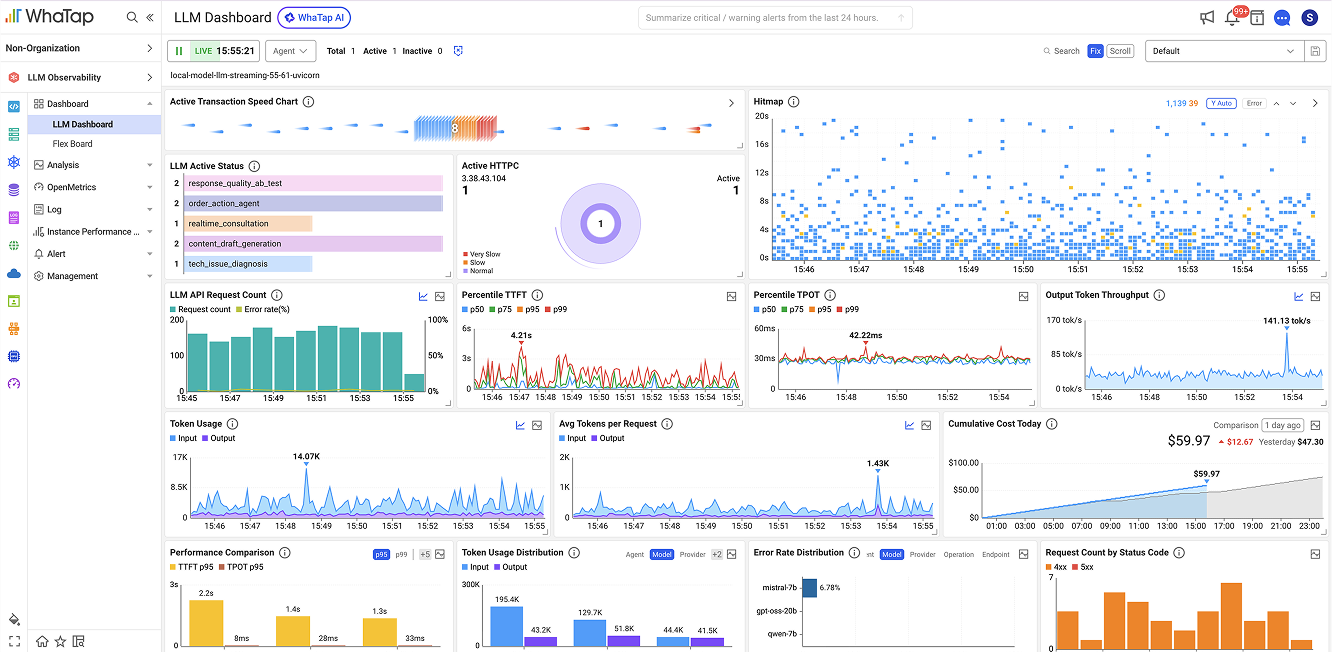
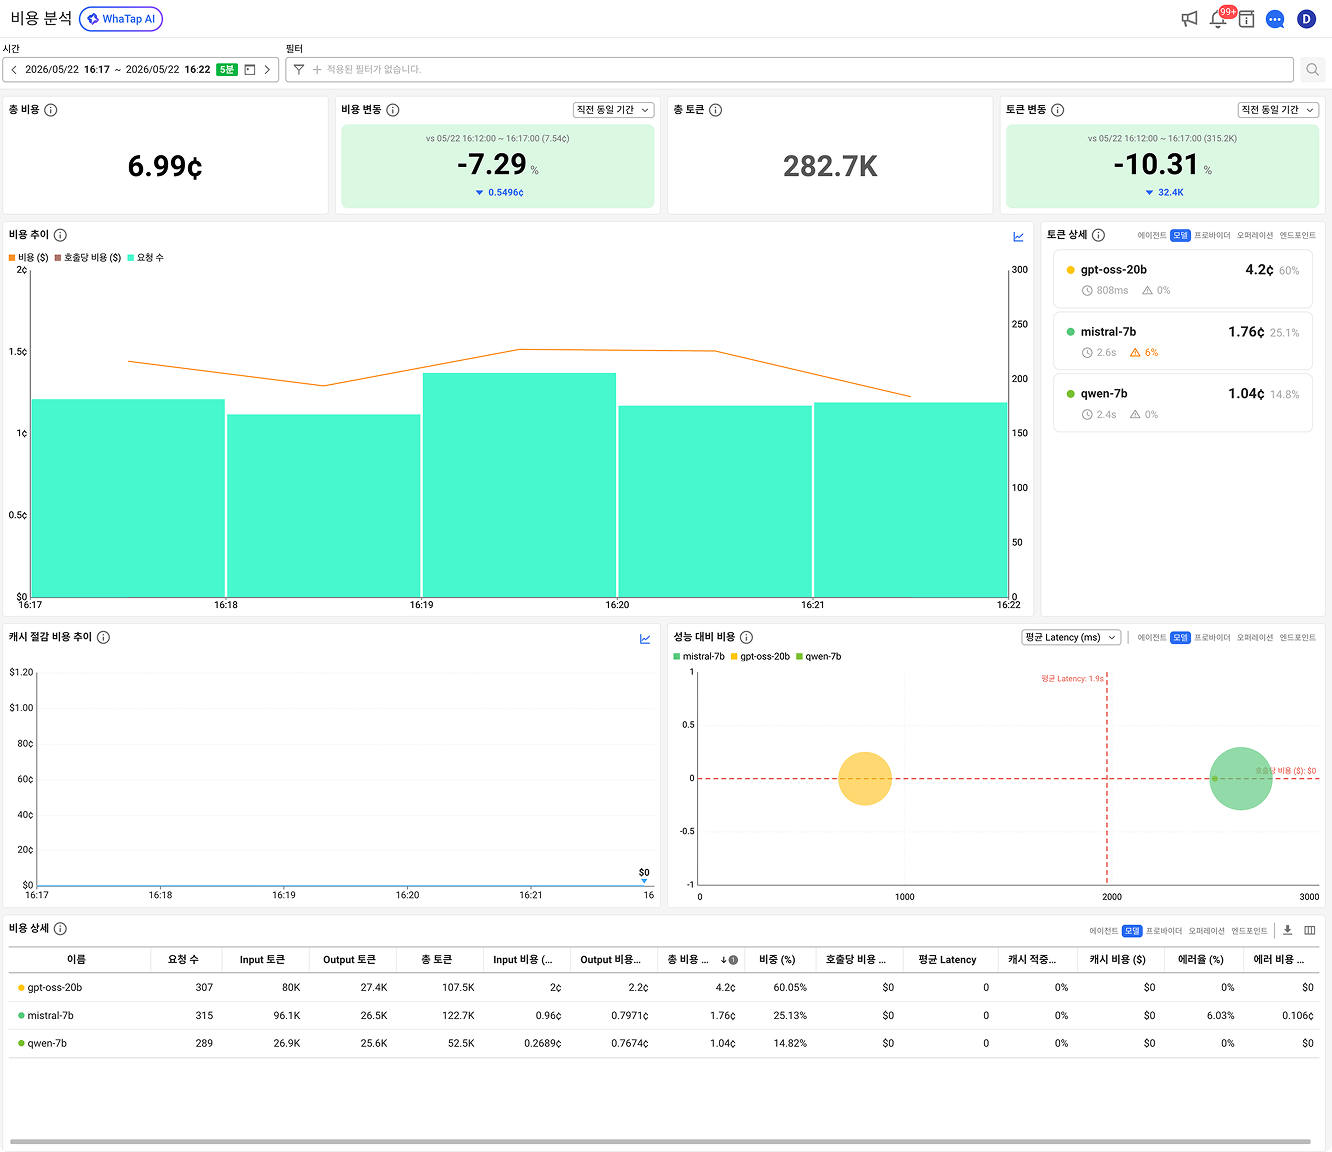
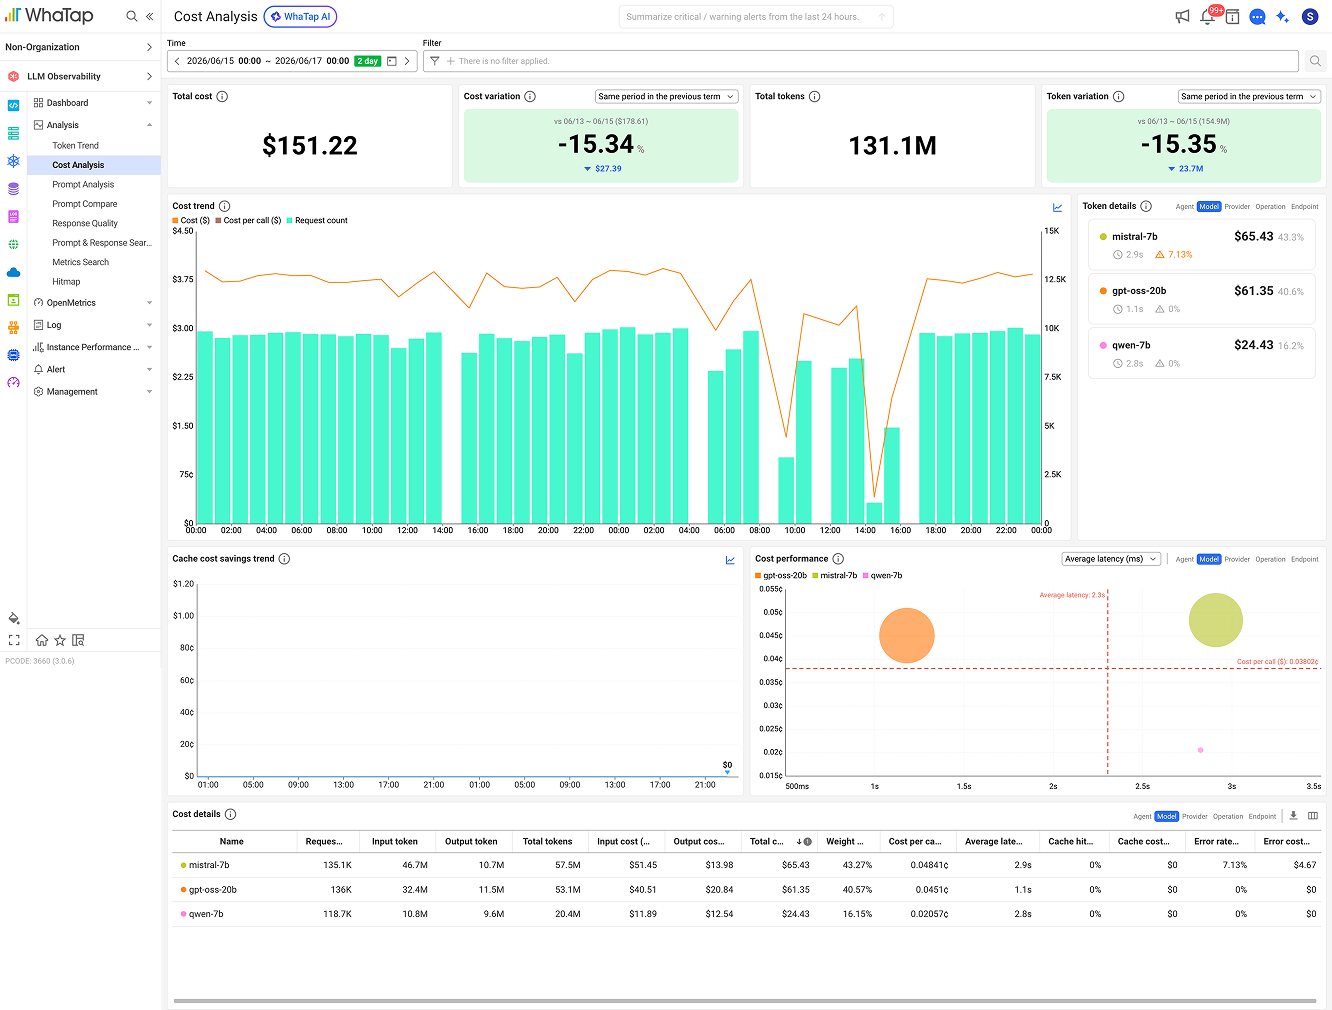
와탭은 모델별 응답 속도, 토큰 사용량, 에러율, 비용 흐름을 함께 비교하여 성능 중심 서비스와 비용 효율 중심 서비스에 맞는 운영 판단을 지원합니다.
LLM과 인프라(GPU·K8s)의
통합 트레이싱
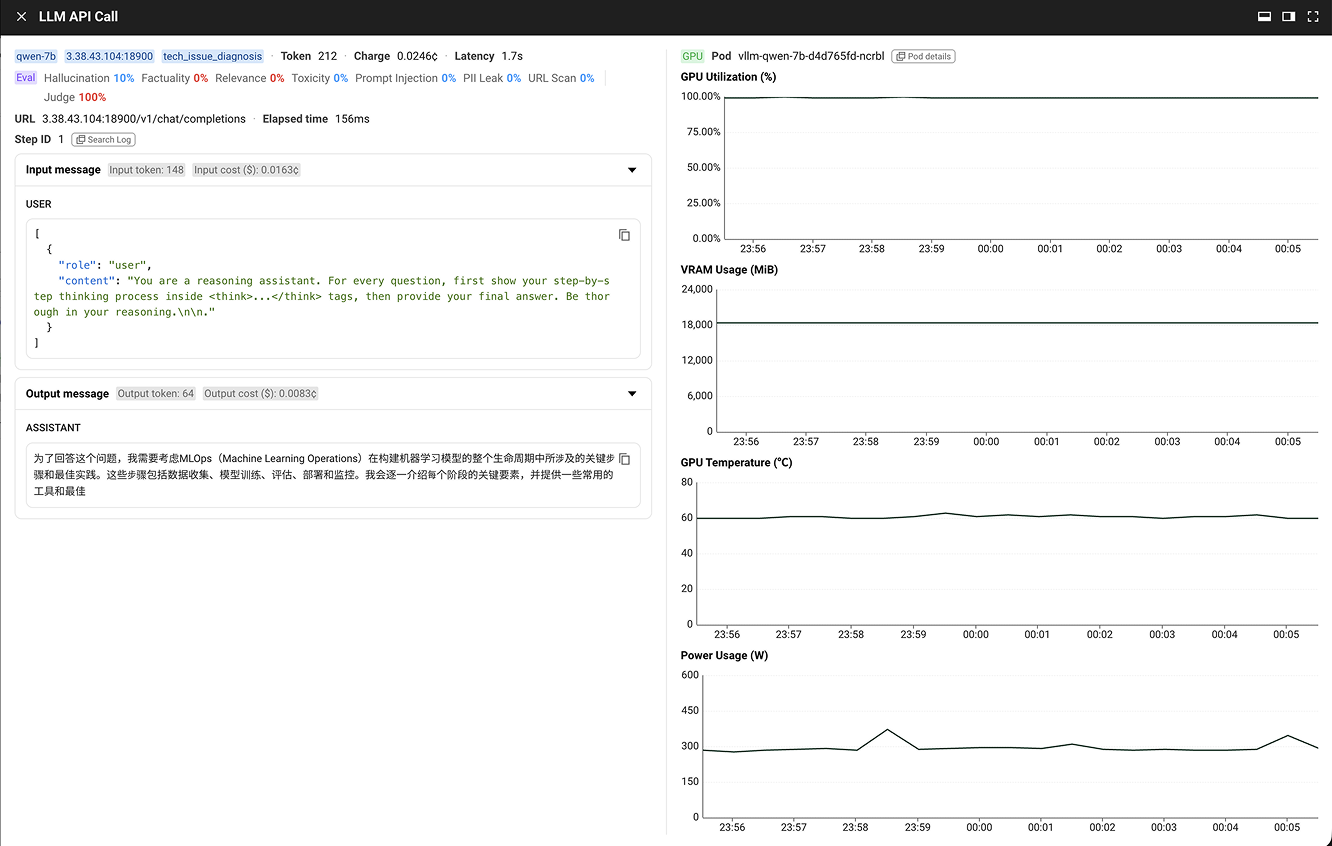
응답 지연이 LLM 처리 문제인지 GPU 자원 병목인지 단일 화면에서 구분합니다. 와탭이 보유한 Full-stack 옵저버빌리티 역량과 결합된 유일한 접근입니다.
와탭 LLM Observability 주요 기능
LLM 운영 가시성 확보부터 비용 최적화까지, 효율적인 AI 서비스 운영을 위한 핵심 기능을 담았습니다.
Network Data Collection
Collect and analyze device status and performance in real time using SNMP polling and traps, Syslog, and ICMP health checks. Detect anomalies and security-related events immediately to ensure network availability.
Flexible Metric Management
Define and extend metrics freely using a hierarchical naming structure. Once registered, metrics can be visualized instantly on dashboards for real-time monitoring, with views tailored by device or service.
토큰 사용량 및 비용 분석
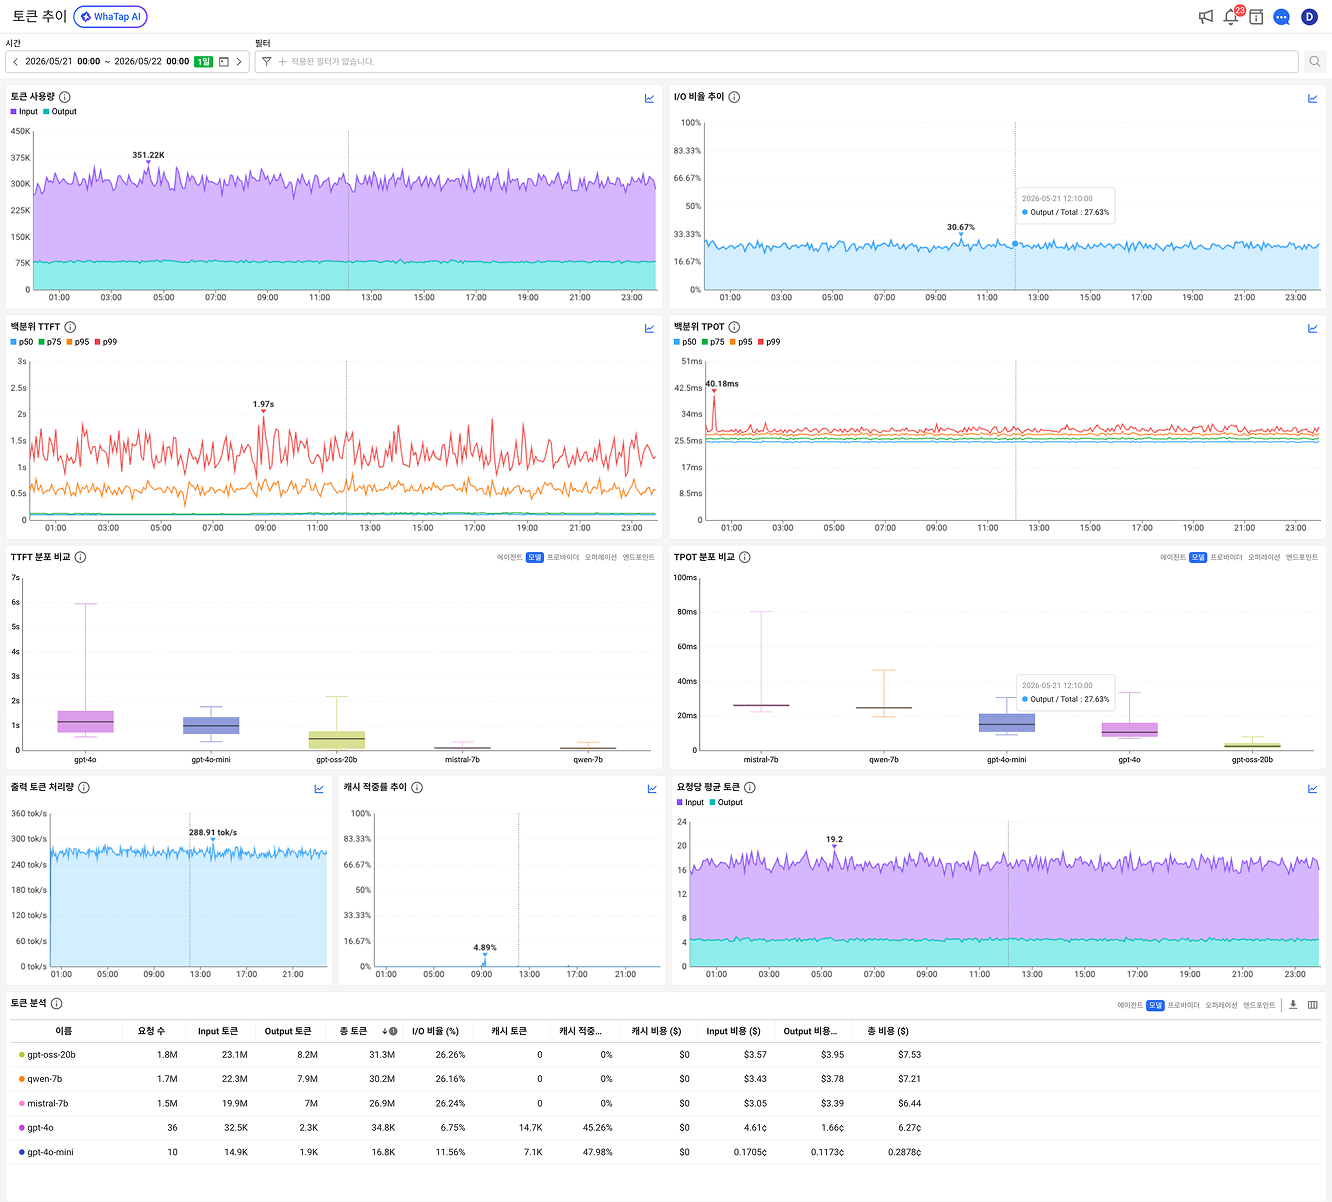
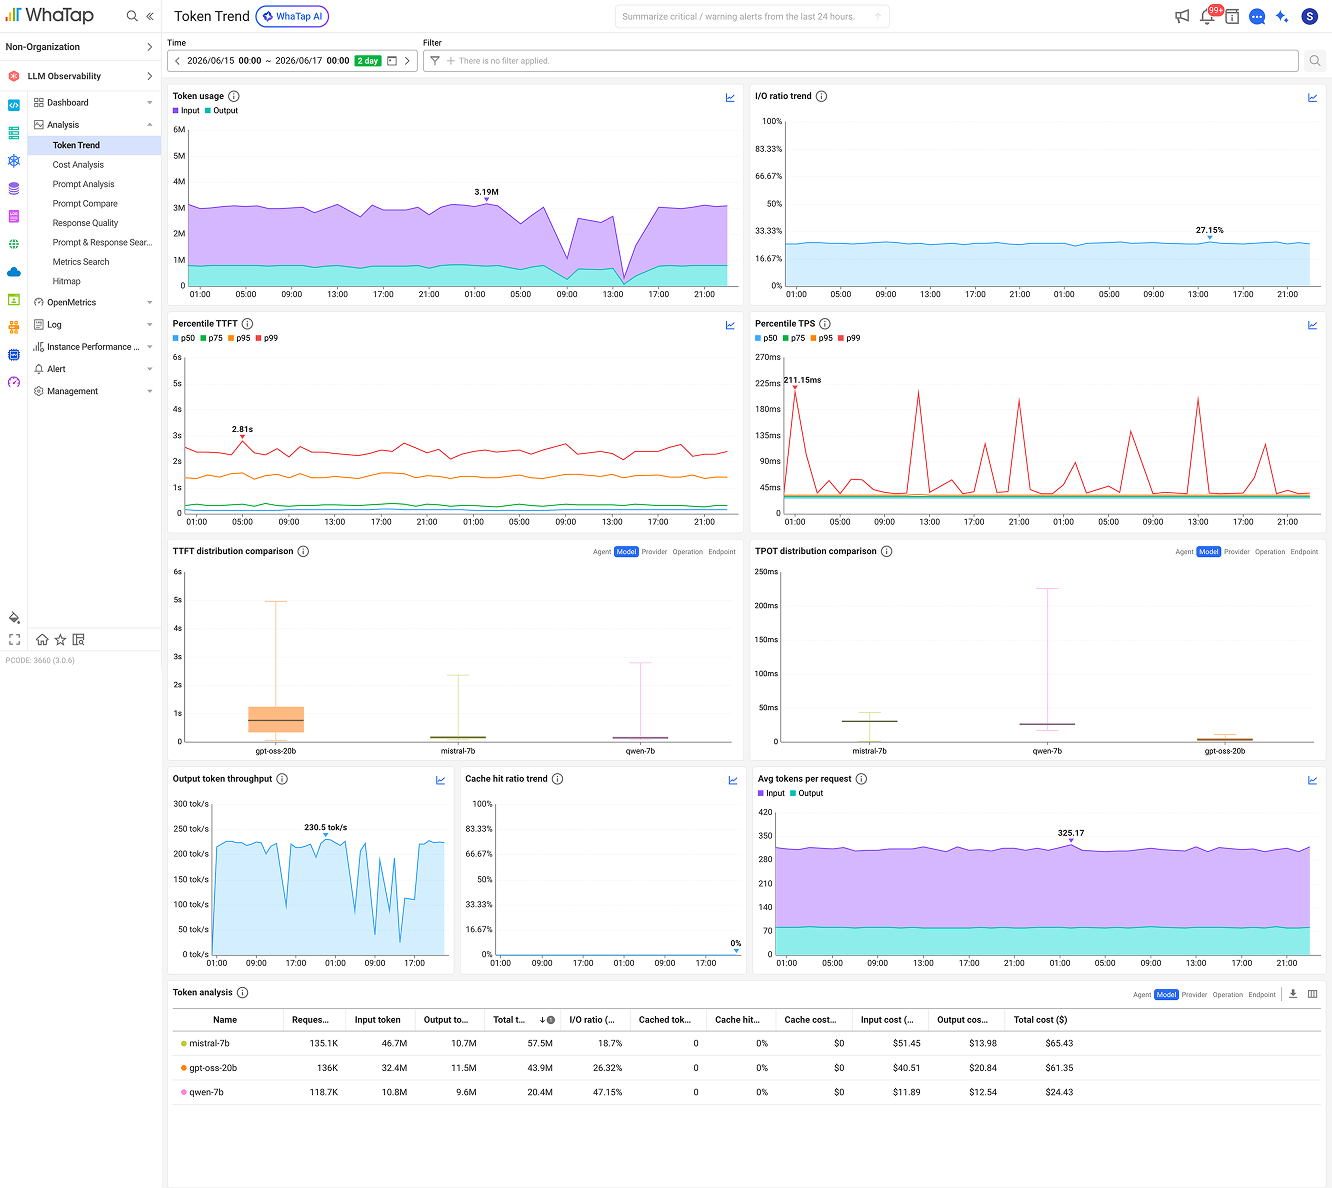
시간대별 입력·출력 토큰 사용량, 요청당 평균 토큰 수, 일별 누적 비용을 추적합니다. 토큰 사용량 대비 비용 비교로 비효율 호출 구간을 식별하고, 모델별 비용 기여도를 통해 예산 최적화 우선순위를 결정할 수 있습니다.
LLM API 트레이스 분석 + GPU 연계
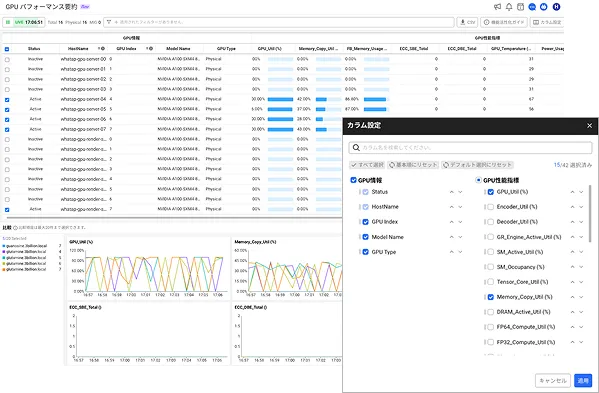
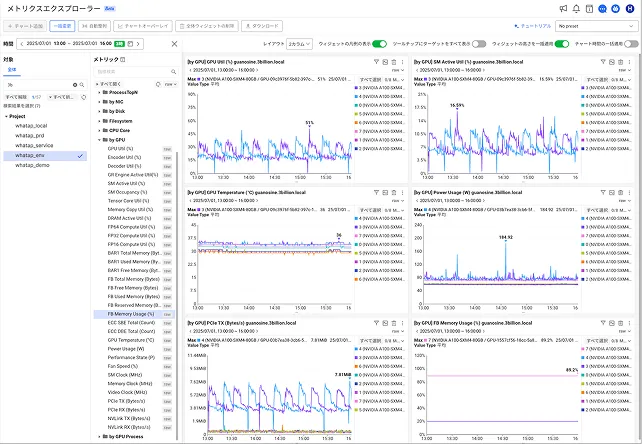
트레이스 단위로 입력·출력 메시지, 토큰 수, 비용, Latency, 호스트 위치를 확인하면서 동일 시점의 GPU 사용량·VRAM·온도를 함께 분석합니다. 응답 지연이 LLM 처리 문제인지 GPU 자원 병목인지 구분할 수 있는 유일한 통합 분석 환경을 제공합니다.
Device-Level Monitoring
Visualize network devices to instantly check port and interface status, and analyze key performance metrics such as CPU, memory, and traffic in context. This enables faster detection of anomalies and supports stable, reliable operations.
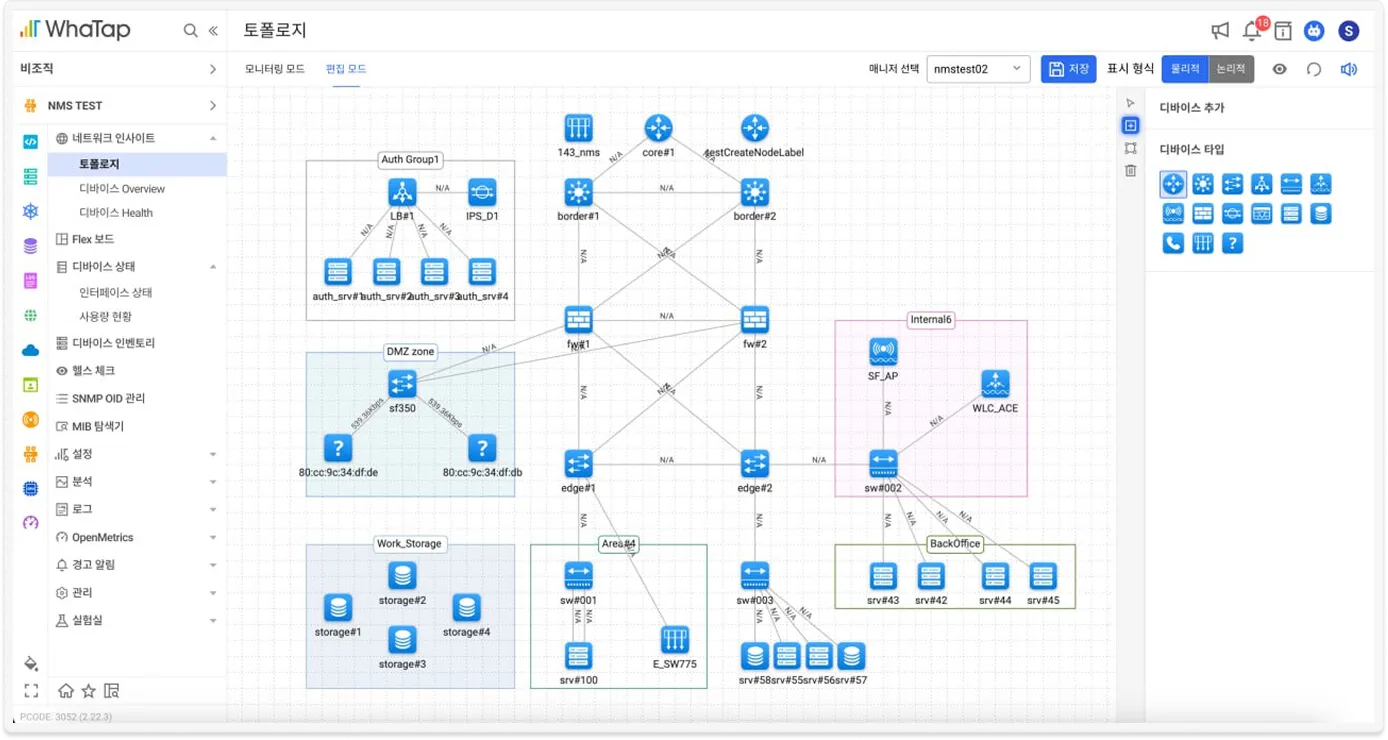
Event-Driven Topology Map
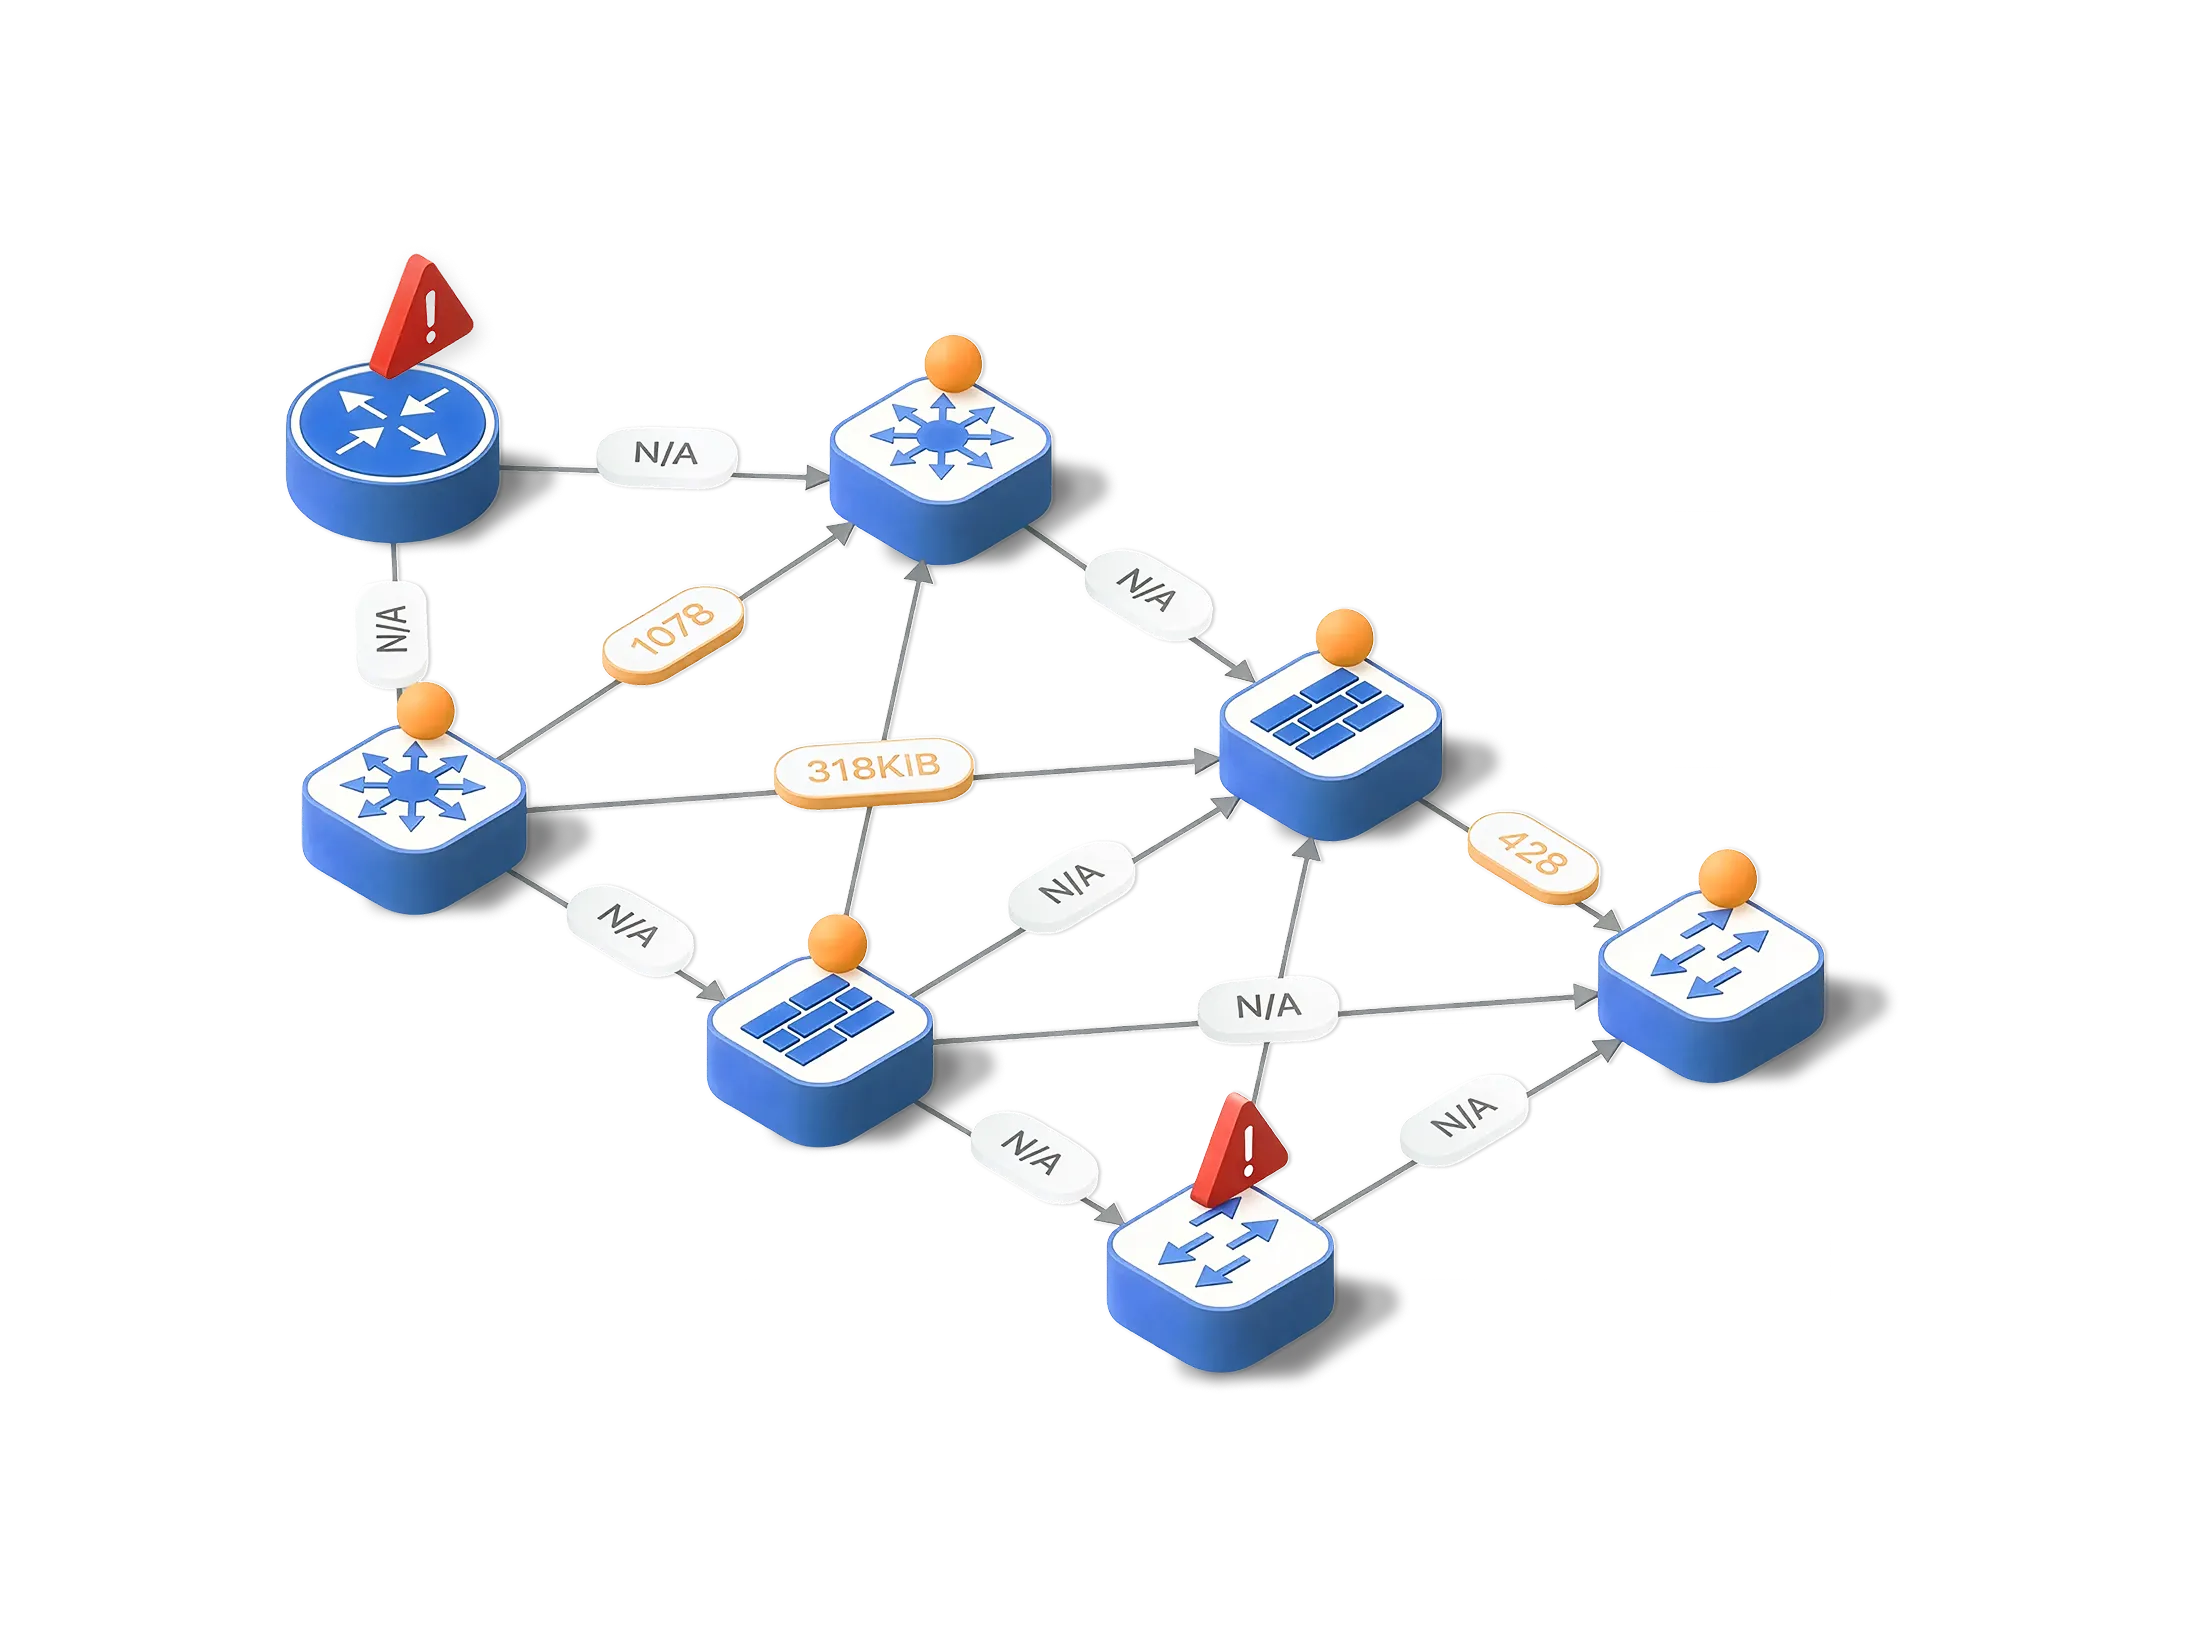
Automatically discover and visualize network topology, adapting seamlessly to device additions and environmental changes. With drag-and-drop editing and real-time event correlation, teams can improve operational efficiency and accelerate incident response.
Top
Contact