.svg)
Share
Copied!


In today’s enterprise IT environment, the shift toward microservices architectures (MSA) and container-based infrastructure has become essential for achieving greater agility and scalability. Gartner predicts that by 2027, more than 75% of organizations worldwide will be running containerized applications in production.
However, while these advances improve operational efficiency, they also create what can be described as a “complexity paradox”: as service architectures become more sophisticated, operational complexity increases exponentially. The root causes of incidents become distributed across services, infrastructure, and platforms, making it increasingly difficult for traditional, siloed monitoring tools to provide a complete view of service flows and dependencies.
For large enterprises in particular, these **monitoring blind spots—or “Monitoring Gray” areas—**can delay incident response, hinder cross-team collaboration, and introduce structural risks to operational stability.
KT encountered these challenges as it transitioned to an MSA and container-based environment. With numerous teams and systems tightly interconnected, KT needed more than a simple replacement for its existing monitoring tools. It needed an integrated monitoring strategy capable of redefining its broader approach to IT operations.
In this customer story, Youngjong Park and Jinbong Kim of the IT Quality Innovation Team within KT’s ITOps Division share how KT used WhaTap to eliminate Monitoring Gray and transition toward a collaborative, data-driven operating model.
Hello, I’m Youngjong Park from the IT Quality Innovation Team within KT’s ITOps Division. I’m responsible for SRE and quality management across both our existing on-premises infrastructure and Azure cloud environments. My role also includes the adoption and expansion of observability solutions, change management, and internal consulting for key services.
As KT’s services increasingly transitioned toward MSA and container-based architectures, we began experiencing gaps in distributed tracing across our container environments—what we refer to as Monitoring Gray. These gaps made it more difficult to detect incidents early and respond quickly.
Previously, our monitoring systems were siloed by layer, including infrastructure, applications, and networks. As a result, we lacked unified visibility across the entire service environment.
This was particularly challenging in container environments, where end-to-end distributed transaction tracing was difficult. That made it harder to quickly pinpoint the root cause of an incident.
These challenges had several negative effects across our teams and service operations:
Ultimately, these issues accumulated into a structural challenge that reduced both incident response speed and overall operational efficiency.
Yes. During a consulting engagement for the implementation of our AWS Landing Zone, WhaTap was recommended to us as a Korean monitoring solution.
At that point, the need for an integrated monitoring platform had become clear, so we evaluated several solutions, including WhaTap.
For a large enterprise, changing a monitoring solution can itself create a significant change management burden. One of WhaTap’s key strengths was its intuitive interface, which felt familiar to Korean users and enabled teams across the organization to adopt the platform relatively quickly.
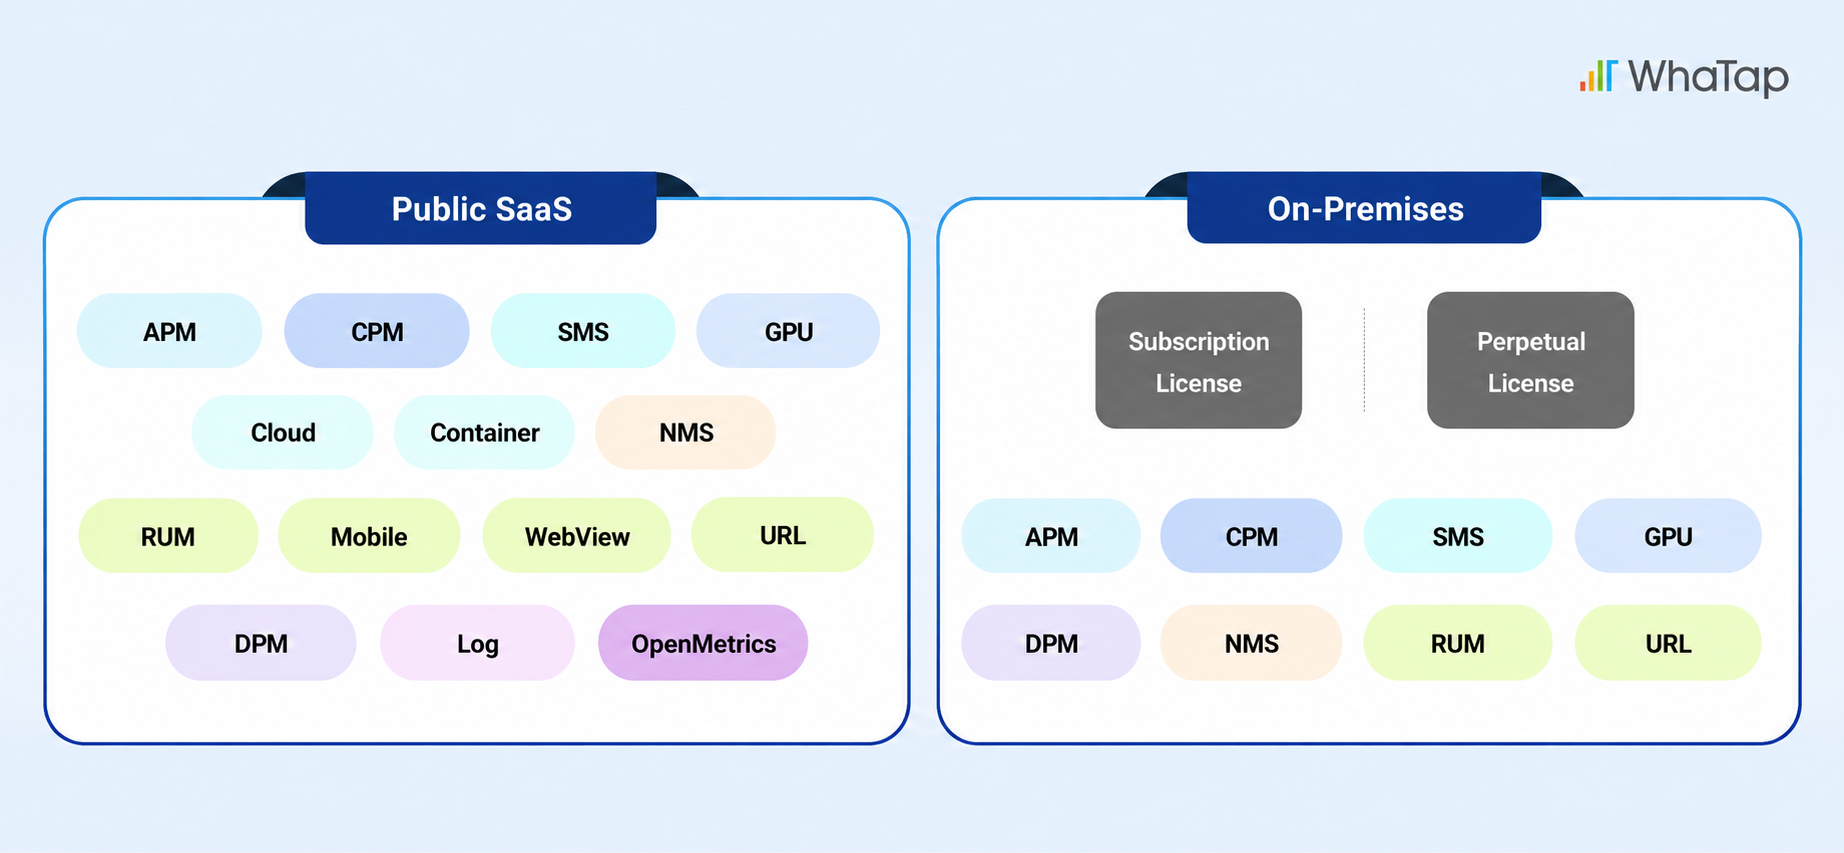
Another decisive factor was WhaTap’s ability to provide both SaaS and on-premises deployment options, while supporting full-stack monitoring—from infrastructure to applications—within a single platform.
That flexibility made WhaTap particularly well suited to KT’s hybrid environment, where on-premises and cloud infrastructure coexist.
Yes. During the on-premises implementation, the WhaTap team provided hands-on support to optimize the deployment for our KT Cloud environment. They also helped us implement the solution in line with our internal monitoring standards and policies.
What stood out most was their understanding of the unique requirements of an enterprise environment. Their flexible, hands-on approach was extremely helpful throughout the implementation process.
After implementing WhaTap, we applied full-stack monitoring and distributed transaction tracing across KT’s on-premises MSA and container environments, eliminating many of our Monitoring Gray areas.
More specifically, we standardized integrated monitoring dashboards for individual services. This enabled our cloud, infrastructure, and application teams to monitor and respond together using the same shared view.
As a result, many of the communication challenges we had previously experienced also improved naturally.
Previously, responsibilities were divided across different teams. The KT Cloud team managed the KT Cloud OKD cluster environment, ktds application teams managed container service namespaces, and ktds infrastructure teams managed VMs, operating systems, middleware, and databases.
Each team relied on monitoring solutions specific to its own layer. Today, WhaTap serves as the foundation of our full-stack monitoring environment, allowing us to manage the entire service stack more consistently.
When an incident occurs, teams can quickly identify the affected area through the integrated dashboard and begin root cause analysis and remediation with a shared understanding of the situation.
Instead of responding with “There’s nothing wrong on our side,” teams now collaborate using a common set of data.
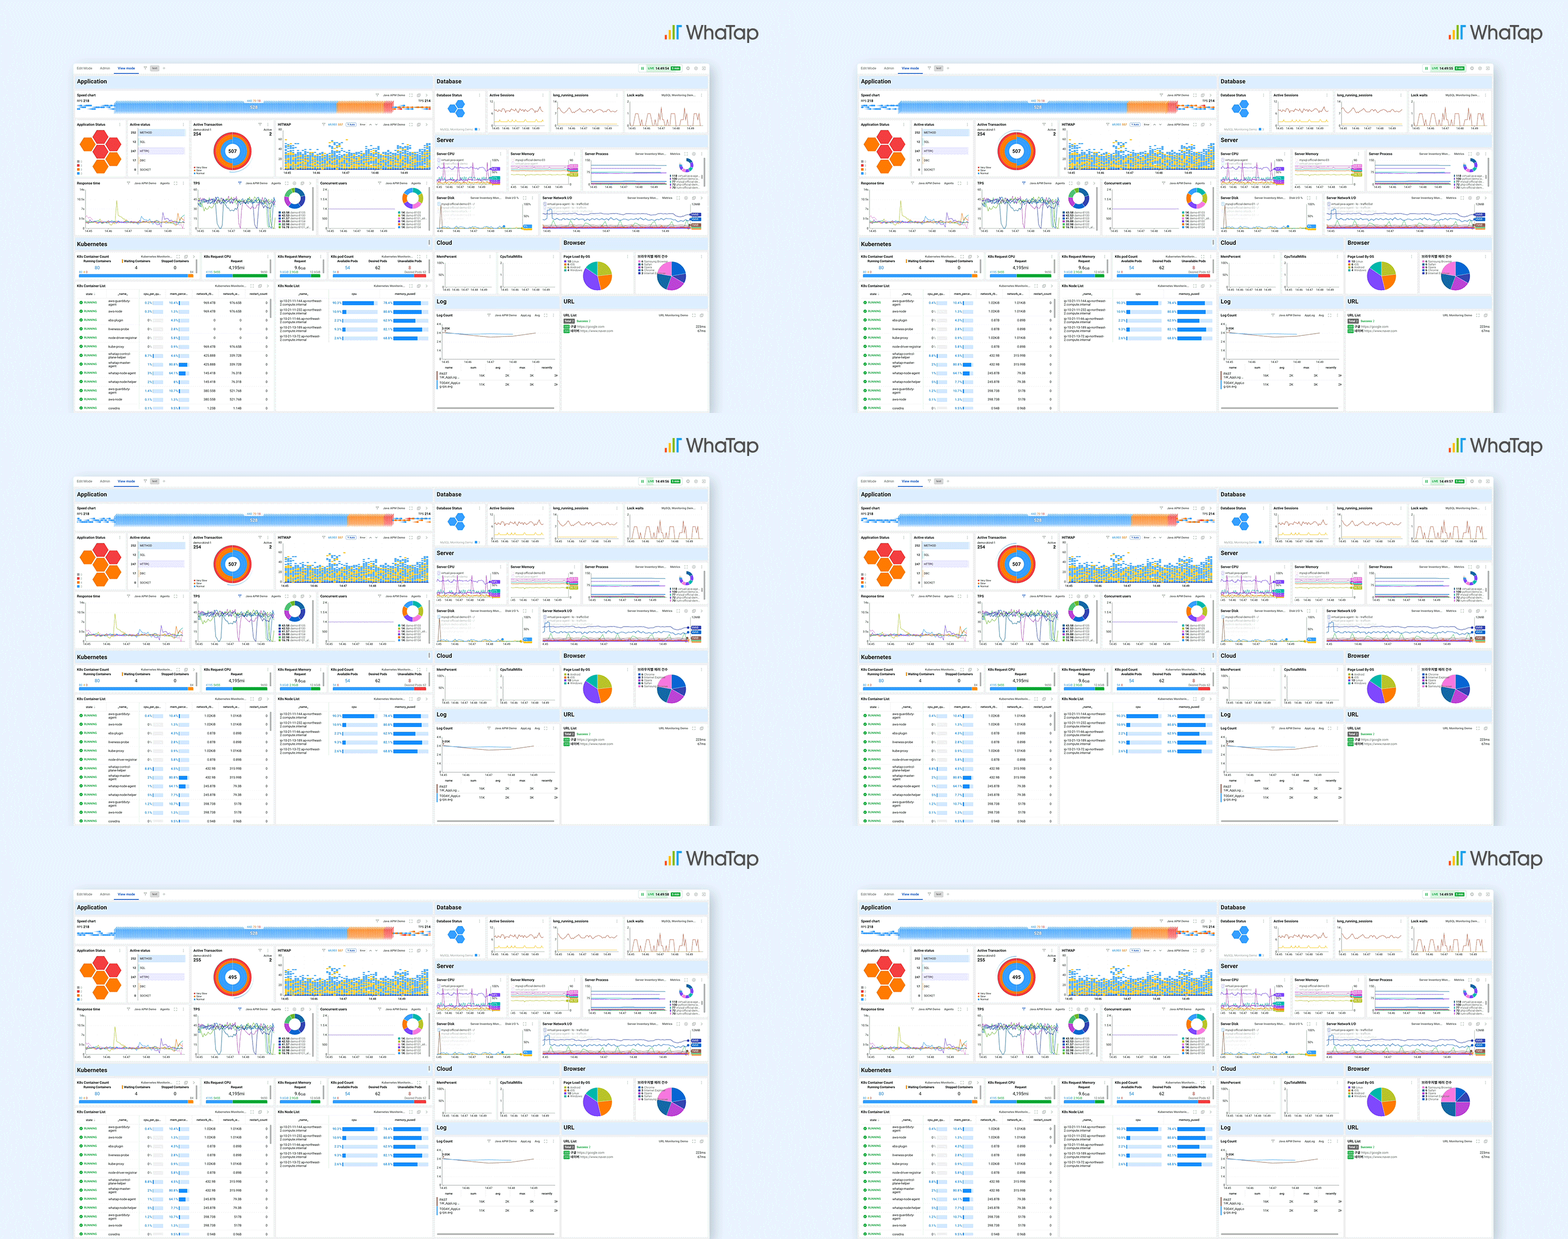
KT’s integrated monitoring dashboard built with WhaTap

The container monitoring capabilities and integrated dashboards have been particularly valuable.
With our previous Prometheus and Grafana environment, we could only access certain information in a fragmented way. WhaTap enables us to analyze that information intuitively within a single interface, allowing us to understand incidents much faster and more accurately.
Being able to visualize complex transaction flows across container environments at a glance has made a particularly significant difference.
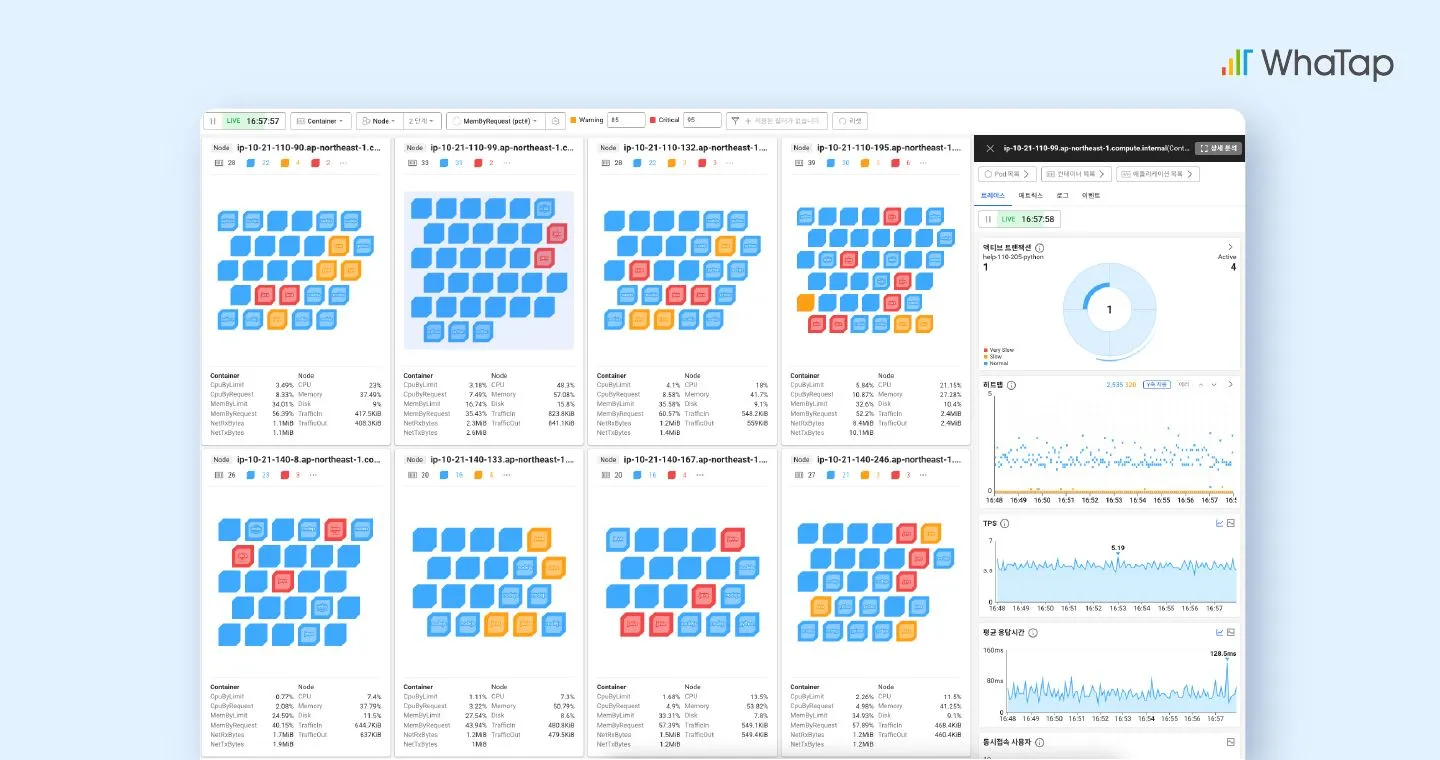
WhaTap provides at-a-glance visibility into container-level resource status and transaction flows.
We can also view metrics from multiple layers—including containers, servers, and applications—within a single dashboard.
When an incident occurs, this means teams no longer have to switch back and forth between multiple tools. They can understand the overall situation from the very beginning of the response process and take action more quickly.
This unified visibility has significantly improved both operational efficiency and incident response speed.
WhaTap’s integrated dashboard provides unified visibility across containers, servers, applications, and other layers.
Since implementing WhaTap, we have eliminated many of the Monitoring Gray areas across our environment, including those within our container infrastructure. As a result, we’ve seen clear improvements in both incident detection and response.
While we haven’t formally quantified these improvements, incident duration has noticeably decreased, and the time required to identify root causes has also improved significantly.
There have also been meaningful qualitative changes.
Cloud, infrastructure, and application teams now analyze and respond to incidents together using the same shared view. This approach has become a natural part of our operations and has significantly improved collaboration.
At the same time, awareness of the importance of monitoring has increased across the organization.
Previously, when an incident occurred, teams often spent considerable time discussing ownership based on what they saw in their respective monitoring tools. Today, teams use the integrated dashboard to quickly establish a shared understanding of the problem and focus their discussions on how to resolve it.
WhaTap has significantly improved the reliability of customer-facing KT services such as PASS and HiOrder.
Eliminating monitoring blind spots and enabling faster incident response have directly contributed to higher service availability, which in turn has improved the customer experience.
At the same time, by reducing the amount of time IT teams spend on repetitive incident analysis and cross-team coordination, we’ve created an operating environment where teams can focus more of their time on higher-value work.
A virtuous cycle: eliminating Monitoring Gray improves service reliability, which ultimately leads to a better customer experience.
.png)
I would highlight four key strengths.
First, its cost-effectiveness compared with global solutions.
WhaTap provides enterprise-grade capabilities with a competitive pricing structure, helping us reduce the burden associated with both implementation and ongoing operations.
Second, full-stack monitoring across the entire service environment.
Being able to monitor everything from infrastructure to applications within a single platform has been a major advantage.
Third, the availability of a SaaS offering.
As we rapidly expand our Azure environment, WhaTap’s SaaS offering gives us the flexibility to adapt to these changes.
Finally, its intuitive UI and low learning curve.
No matter how powerful a solution is, it has limited value if people cannot effectively use it in day-to-day operations. WhaTap has a clear advantage in terms of usability and user adoption.
.png)
Going forward, one of our key objectives is to implement AIOps-driven operational automation across cloud environments such as Azure using WhaTap.
We plan to use metrics and log data collected across IaaS, PaaS, and applications to assess operational health and ultimately build a system capable of predicting incidents and responding to them automatically.
Our long-term goal is to move beyond today’s reactive operating model and establish a proactive, automated approach to IT operations powered by the data accumulated in WhaTap.
By implementing WhaTap, KT has eliminated Monitoring Gray, transformed cross-team collaboration, and moved toward a more data-driven operating model.
Cloud, infrastructure, and application teams now collaborate around a unified dashboard and a shared source of operational data. This has delivered tangible improvements, including faster incident response and greater service reliability.
WhaTap has become a core operational platform for managing KT’s complex hybrid environment, providing a strong foundation for improving operational efficiency across the organization while delivering a better customer experience.
Looking ahead, KT plans to progressively expand its use of AIOps and operational automation with WhaTap, evolving from reactive incident response toward predictive and proactive operations.
Want to eliminate monitoring blind spots and build a data-driven operating model around a shared view, just like KT?

%201.svg)


%201.svg)