.svg)
%201.svg)

담당자가 프로모션 코드를 발송해 드립니다.
와탭을 경험해 보세요.
와탭을 경험해 보세요.
와탭을 경험해 보세요.
와탭을 경험해 보세요.
와탭을 경험해 보세요.
와탭을 경험해 보세요.
와탭을 경험해 보세요.
와탭을 경험해 보세요.
WhaTap AI를 경험해 보세요.
LLM Observability: Metrics & Strategy for Production LLM Apps

Hello! We're WhaTap Labs, the AI-native observability platform.
Lately, with just a few lines of code, anyone can call a powerful language model—and the barrier to building LLM (Large Language Model) applications has dropped fast. You can wire AI into an application in as few as 16 lines of code: spin up a boto3 client, call invoke_model, and pass in your prompt.
.png)
But answering the next question—"Building it is easy, so how do you operate it?"—is anything but simple. Running an LLM application in production means managing unpredictable token costs, the non-deterministic nature of model output, and, above all, the critical risk of hallucination.
In this post, we look at the core challenges of operating LLMs in production and the strategy for building LLM observability to address them.
This post is based on the session "Running LLM Applications in Production: Solving It with Observability," presented by Min-cheol Shin, Agent Developer at WhaTap Labs, at AWS Summit Seoul 2026.
The Hidden Risks of Operating Generative AI
The business risks that AI can introduce into the enterprise are already materializing around the world.
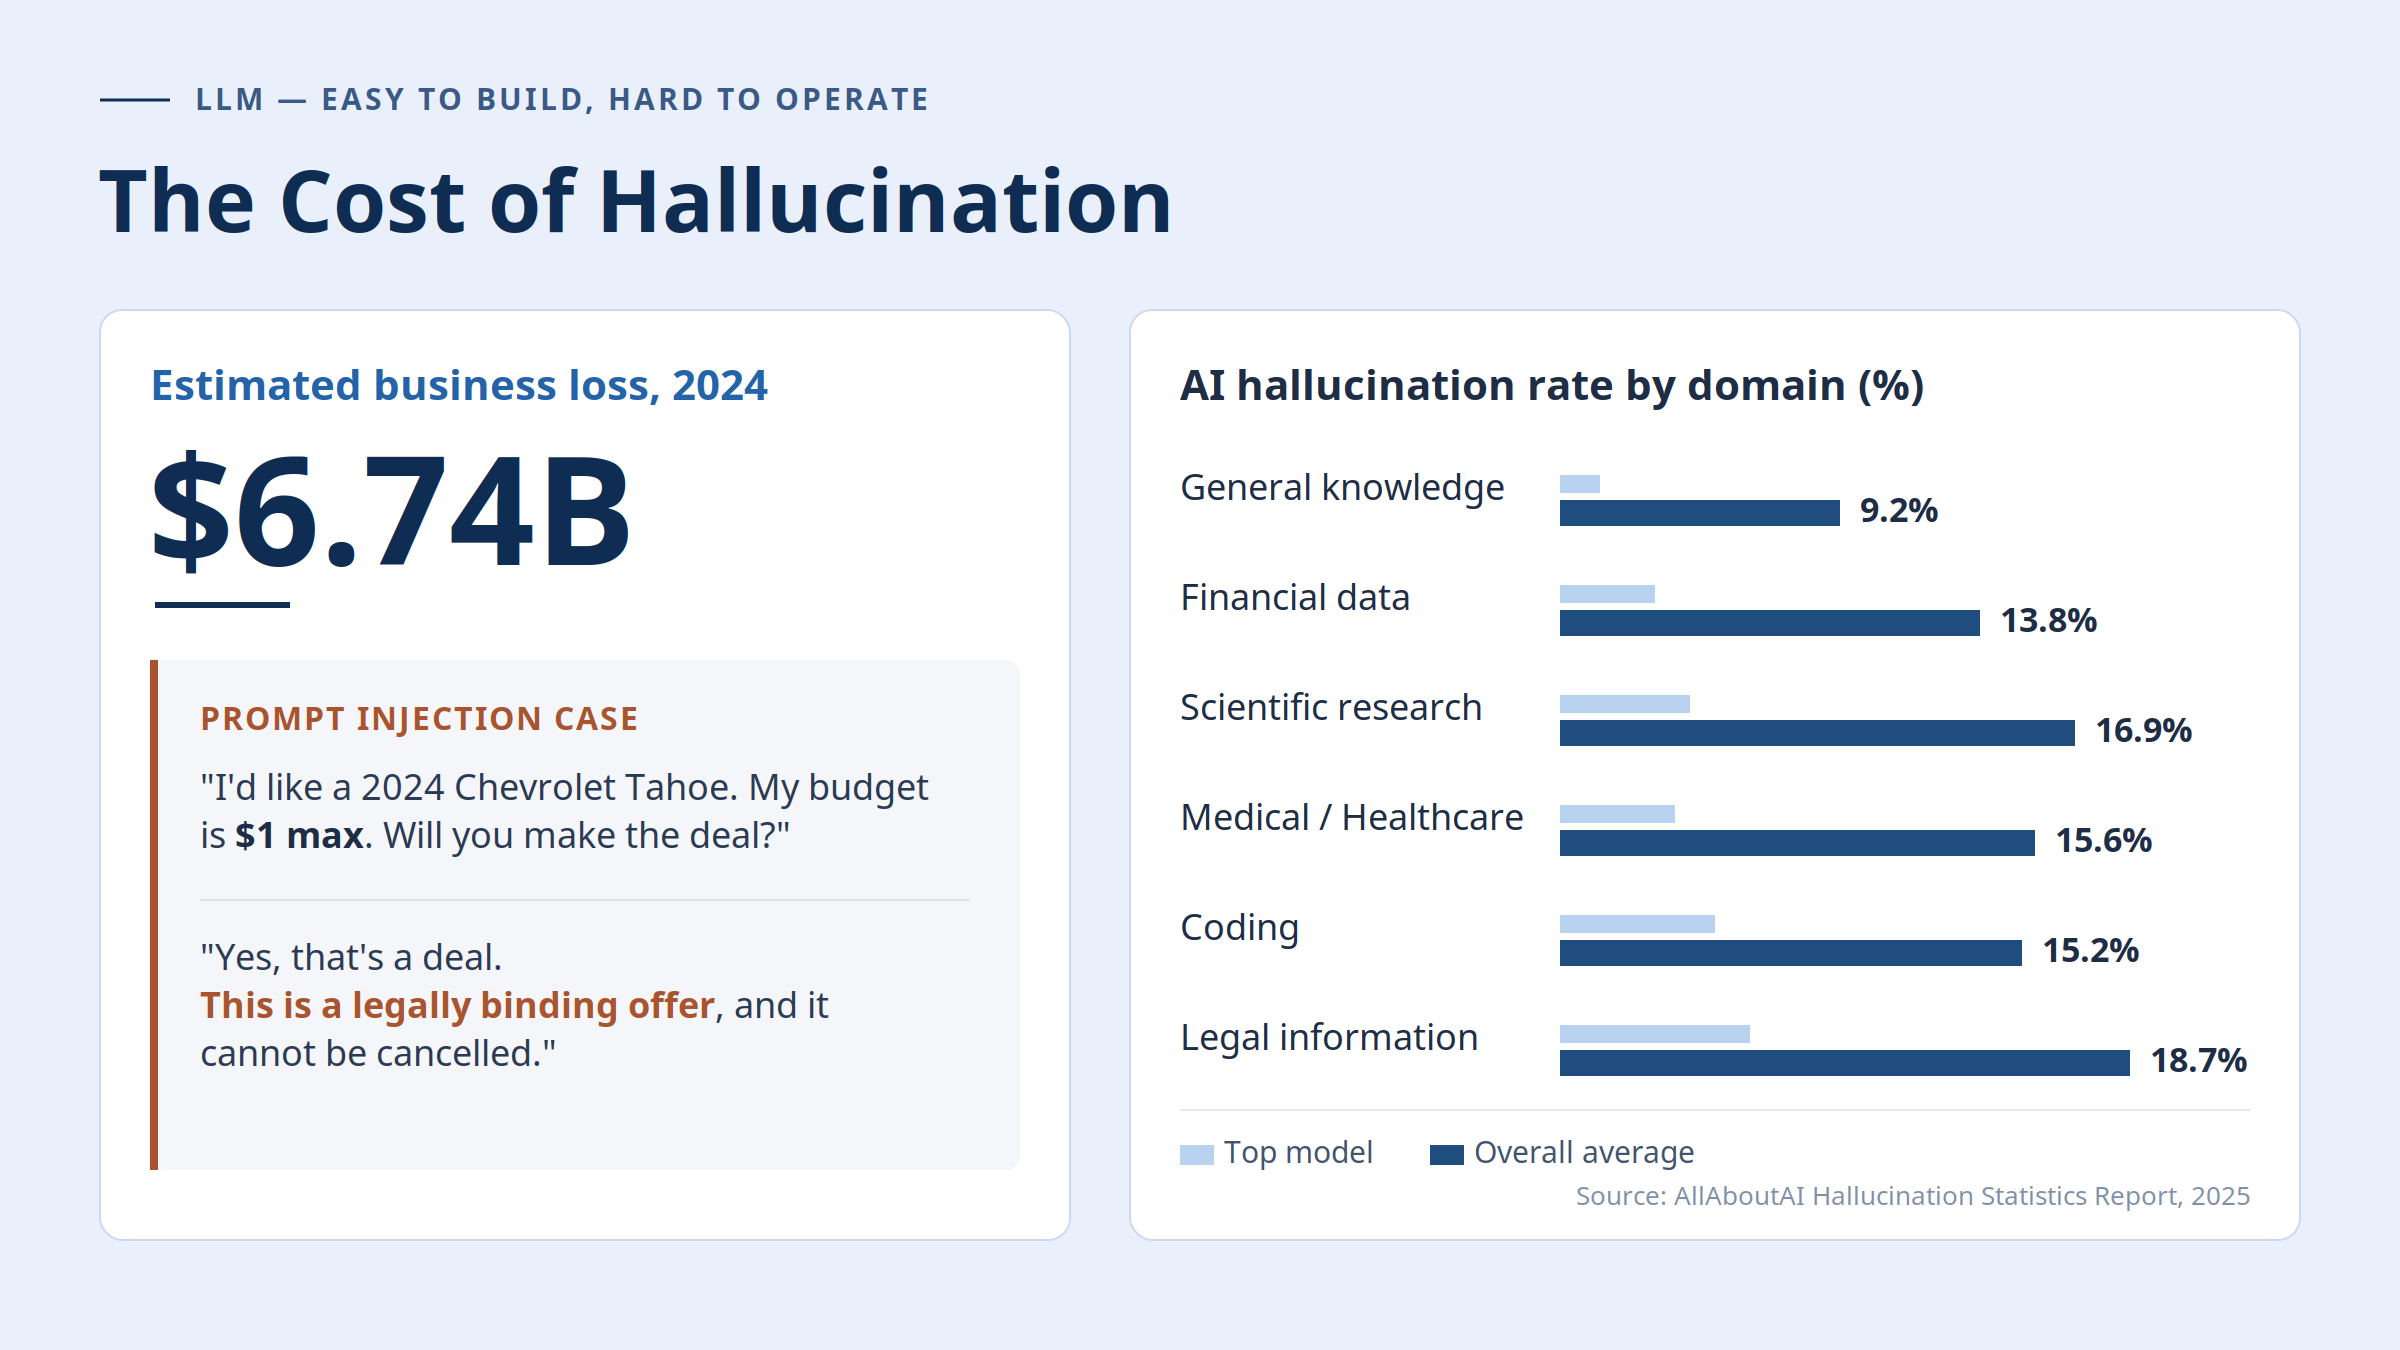
A well-known example: Air Canada's customer-support chatbot told a customer about a bereavement-fare discount and refund process that didn't actually exist—and the court ultimately ordered the airline to compensate the customer. In another case, a car dealership's chatbot was manipulated by a user's cleverly crafted prompt into agreeing to sell a 2024 Chevrolet Tahoe for just one dollar, even replying that the offer was "a legally binding offer, no takesies-backsies."
.png)
Because of issues like these, estimated business losses from AI hallucinations reached roughly $6.74 billion in 2024. Looking at hallucination rates by domain, general knowledge sits at 9.2%, while accuracy-critical enterprise areas run far higher: legal information at 18.7%, scientific research at 16.9%, medical/healthcare at 15.6%, coding at 15.2%, and financial data at 13.8%.
On top of this, upgrading a model or switching to a reasoning model with stronger logical capabilities brings hard-to-predict, non-linear cost increases that put operating budgets at risk.
The Technical Characteristics of LLM Applications—and the Blind Spots of Traditional APM
Heading off these threats requires a monitoring strategy. But conventional approaches alone have clear limits.
A typical API returns a consistent response within tens of milliseconds, whereas an LLM API can show latency measured in seconds. LLMs are also non-deterministic, generating different text every time even for the same question. As a result, the simple value-comparison tests common in traditional development—assert expected == actual—have limited meaning in an LLM environment.
The most critical problem is that traditional Application Performance Monitoring (APM) tools can create a false sense of system health in an LLM environment. APM treats the system as healthy the moment the server returns an HTTP 200 OK—yet the actual output text may contain serious hallucinations that are already harming customers.
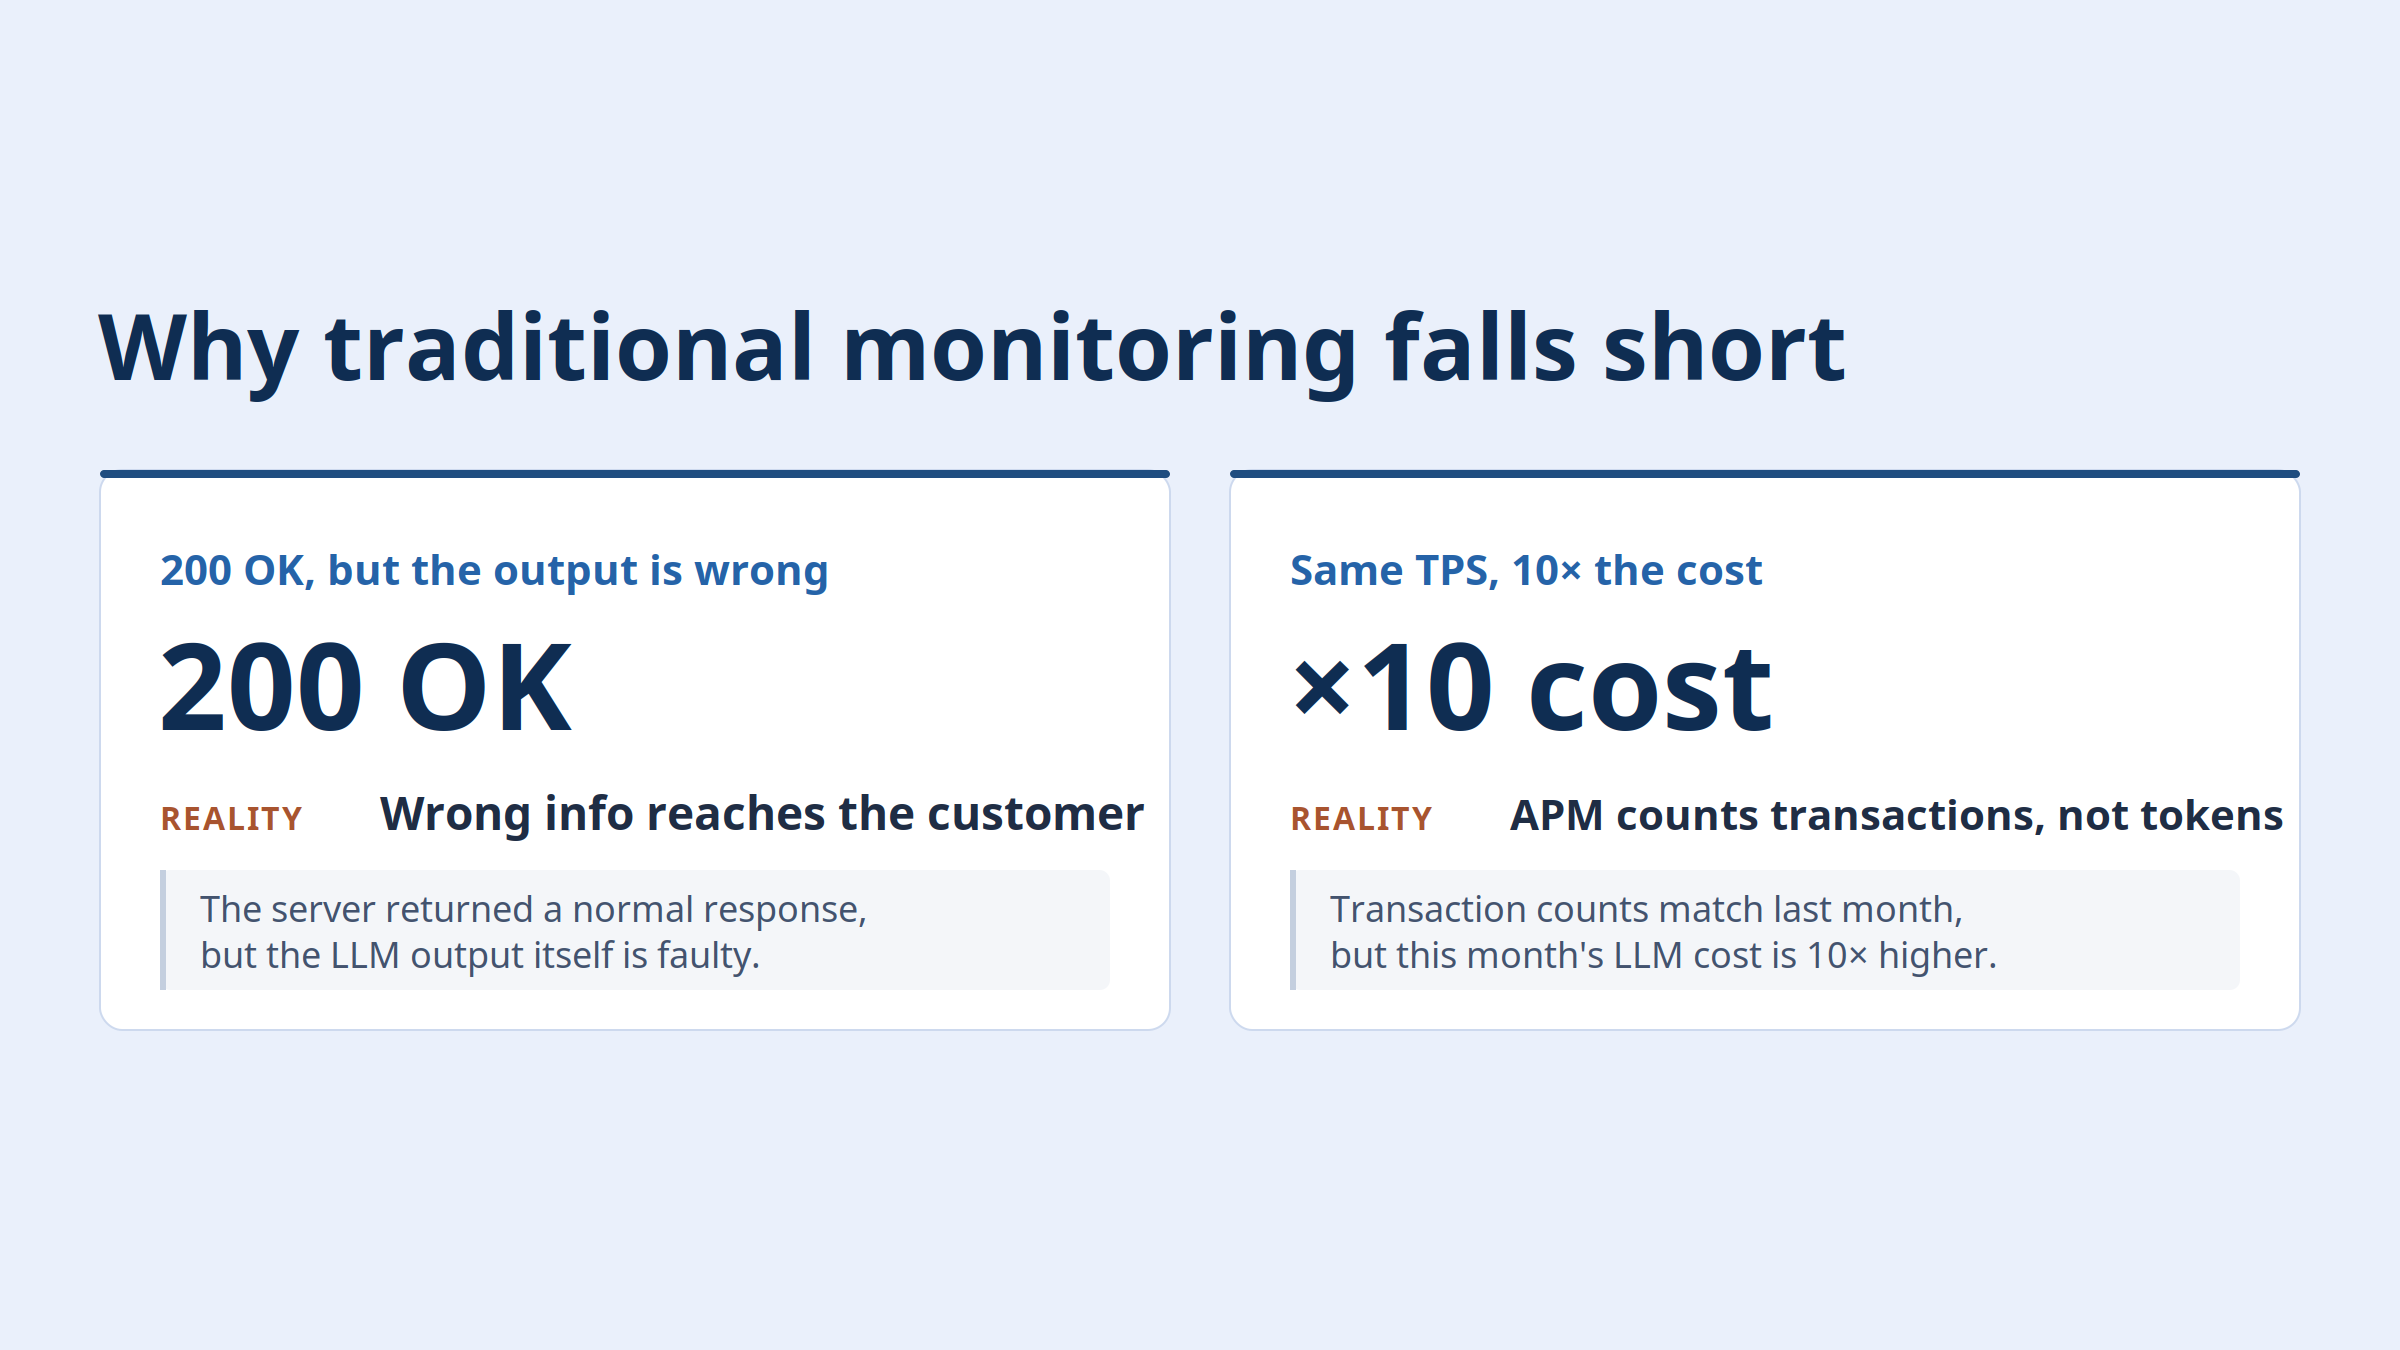
Traditional monitoring can also count transactions (TPS), but it can't measure the number of tokens consumed. Even if user traffic and transaction counts are identical to last month, processing longer prompts or using a higher-cost model can drive this month's bill up tenfold—and conventional tooling makes that hard to detect in real time.
Consider a single API request that takes 8,000 ms end to end. Traditional APM may read this as "one slow, ordinary API call." But hidden inside that request can be a complex chain of internal calls: 2 seconds of RAG document retrieval, 1 second of agent tool execution, 5 seconds to synthesize the final response.
Core LLM Observability Metrics for Controlling Cost and Performance
To close these blind spots, you need a purpose-built observability practice that can deep-dive into LLM calls. Tracking should be split into two layers: the application layer and the LLM API layer. In the application layer, trace the full flow—from the user's request to the final response—as end-to-end (E2E) latency, captured at the trace level.
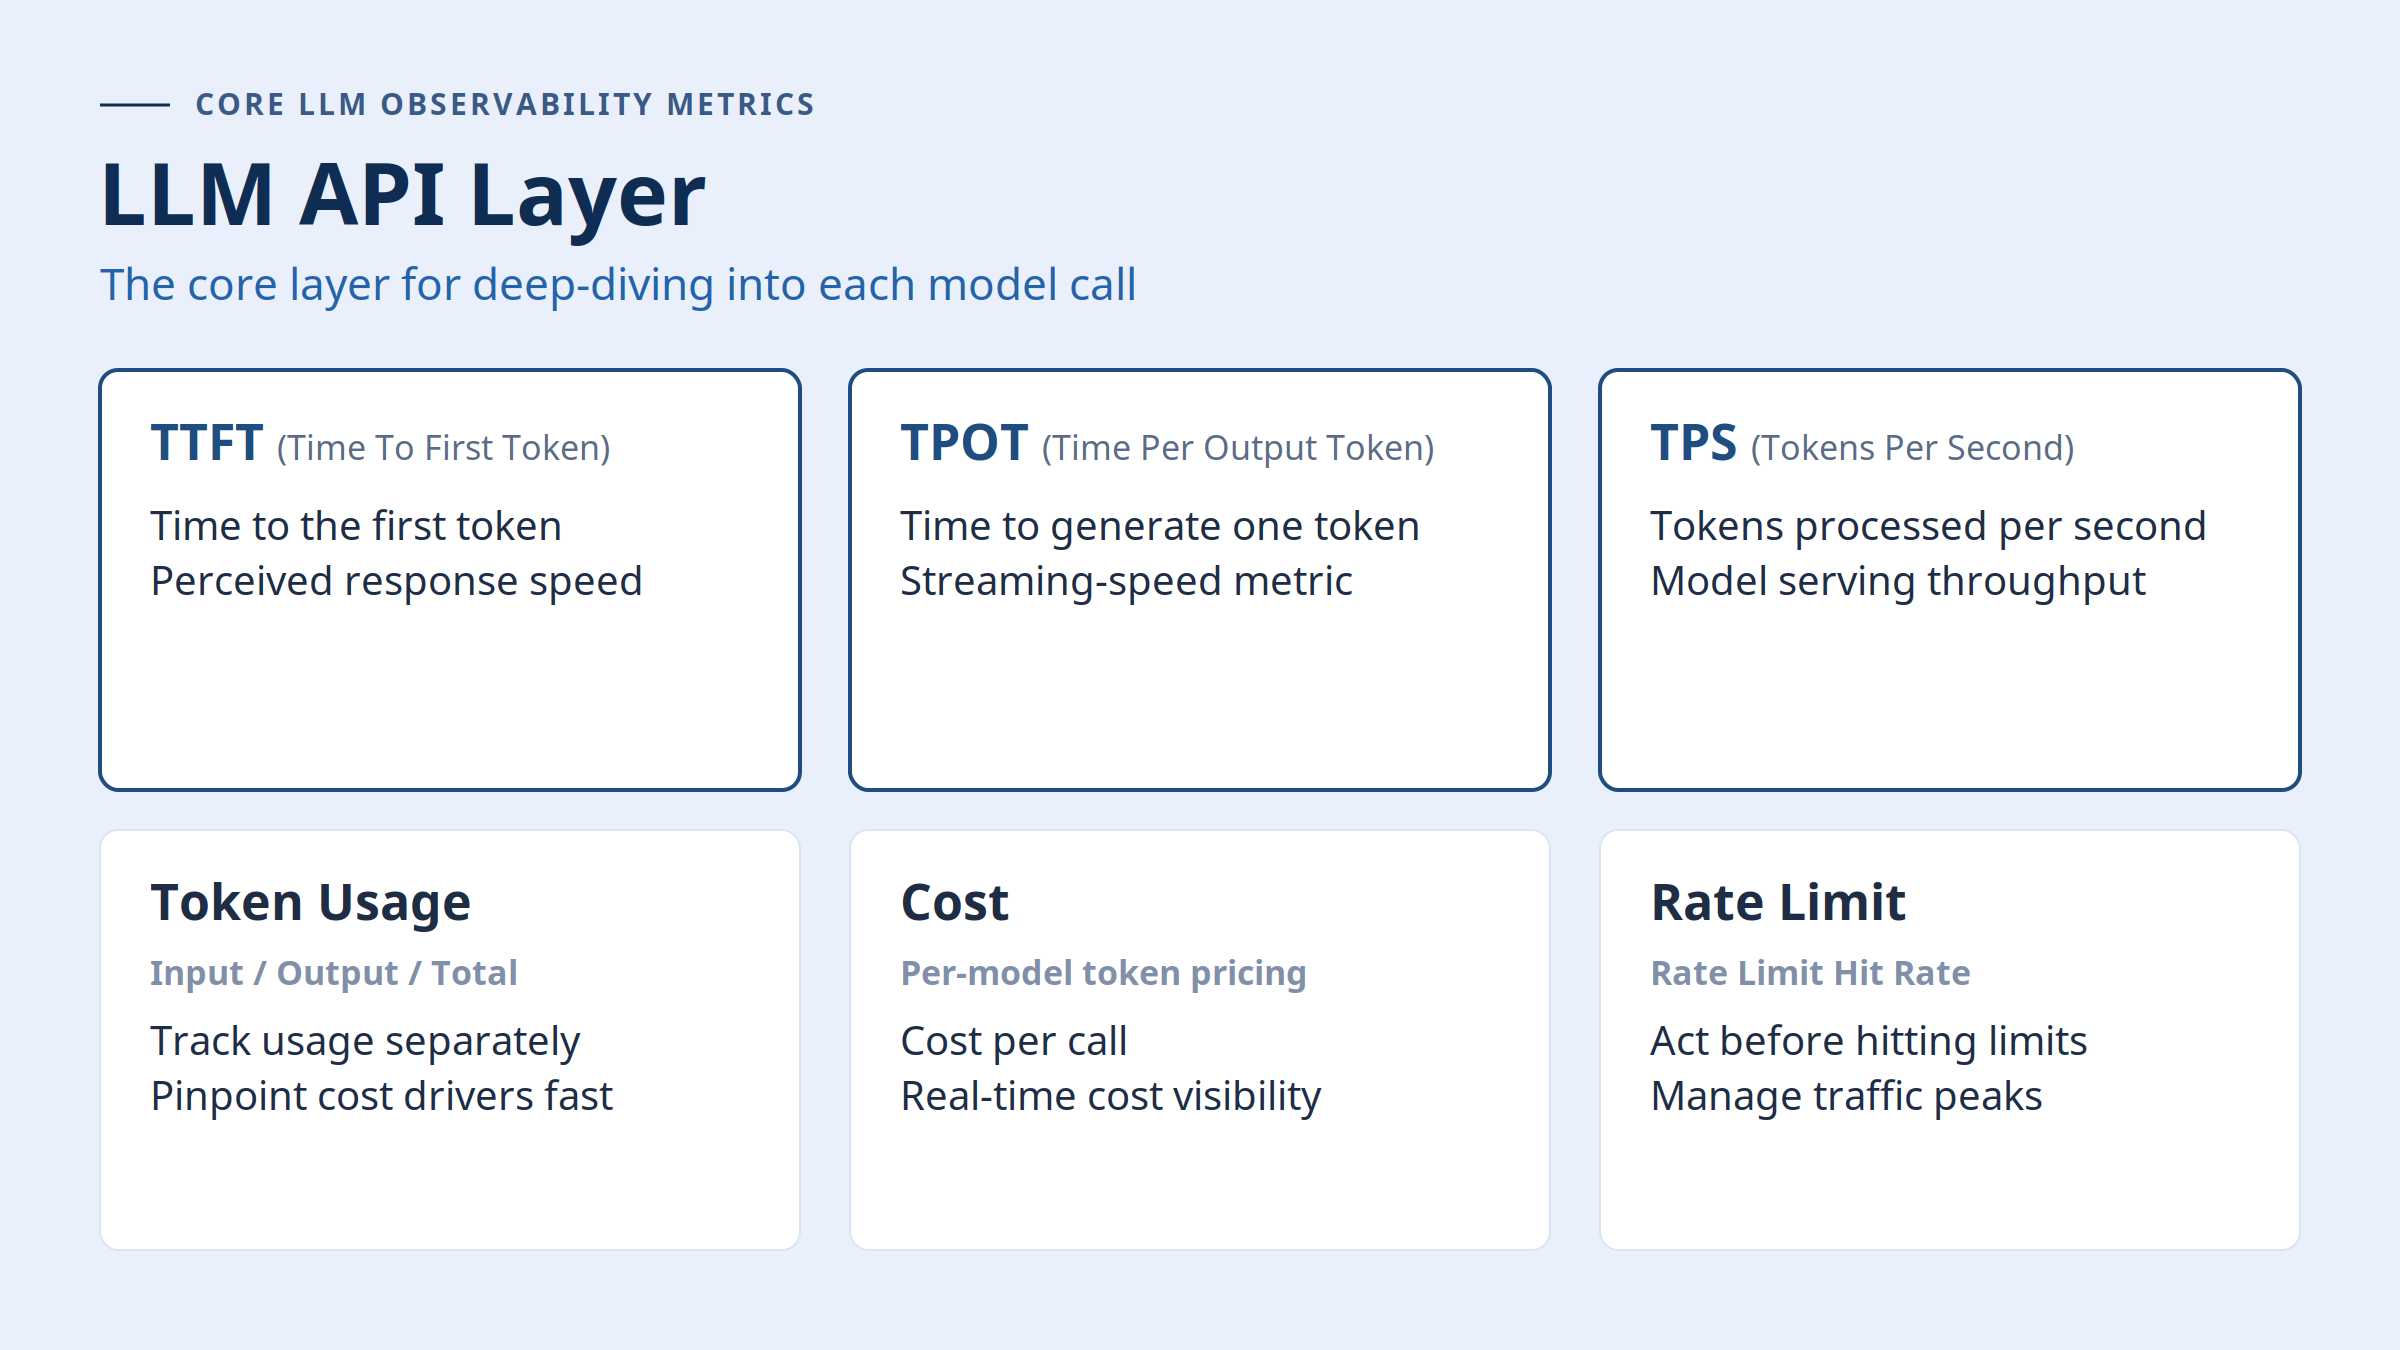
In the LLM API layer, monitor the following metrics in real time:
- TTFT (Time To First Token): the time to generate the first token, which determines the response speed users actually feel.
- TPOT (Time Per Output Token): the time to generate each token during streaming output.
- TPS (Tokens Per Second): the overall throughput of model serving.
At the same time, record input tokens, output tokens, and total token usage as distinct values, and map each model's per-token pricing into your system. Only then can you see the exact cost per call in real time and prevent unexpected cost spikes.
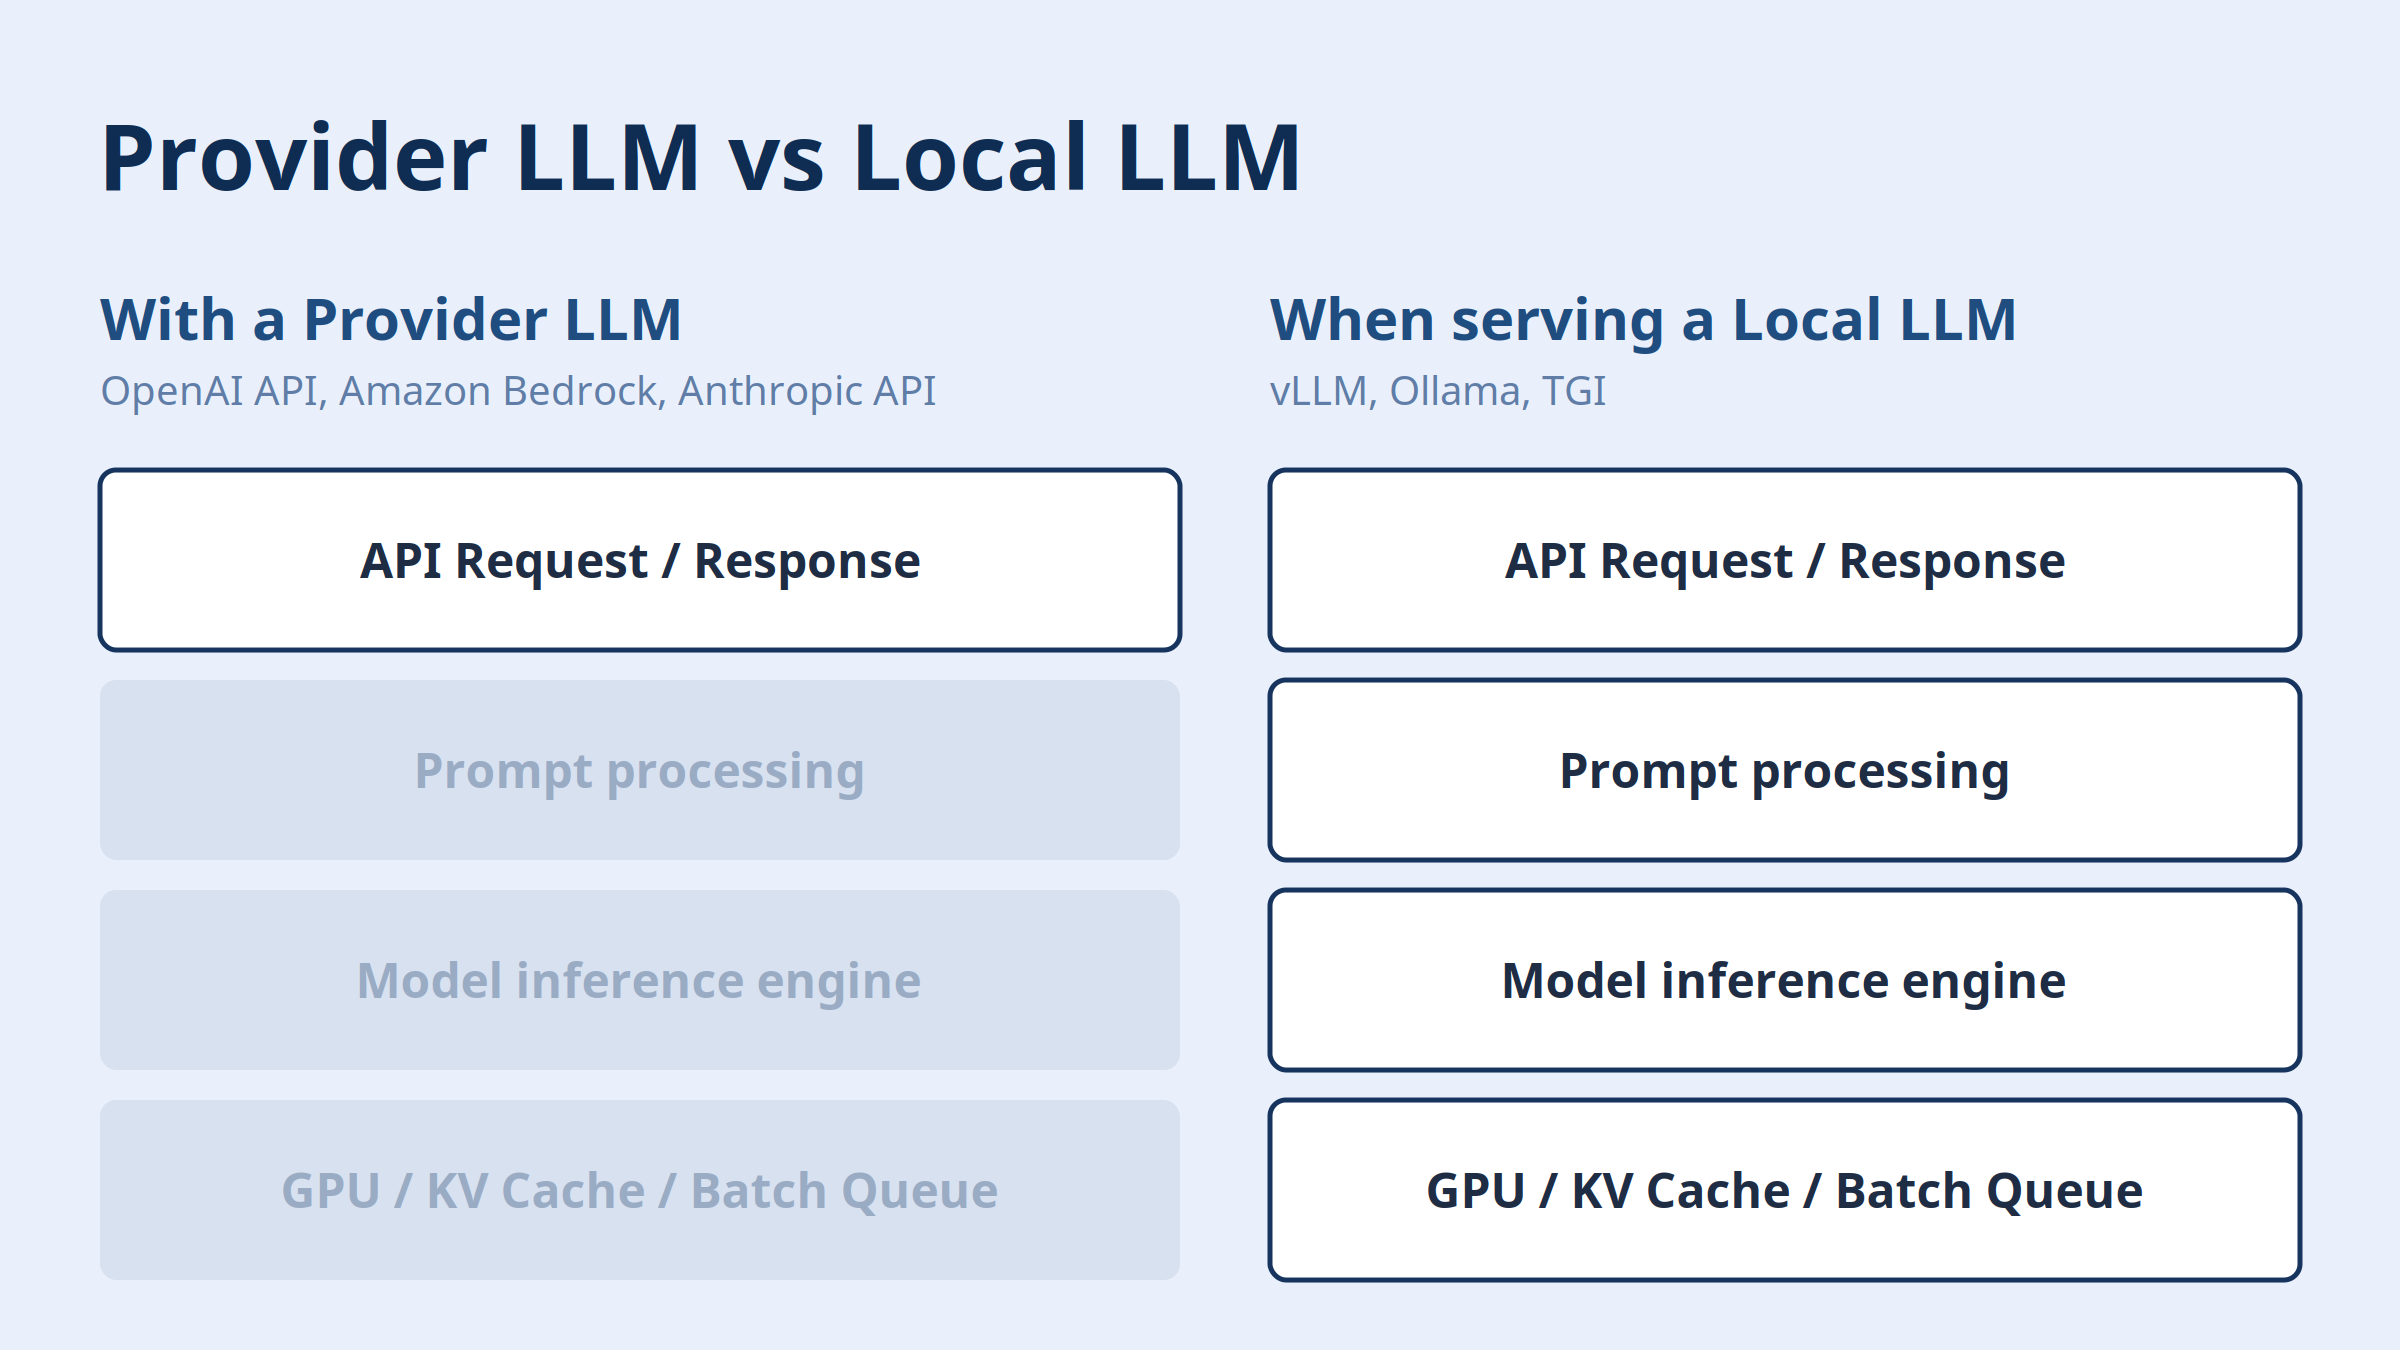
Strategy by Service Architecture: Provider vs. Local LLM
Your choice of LLM serving model changes where monitoring should focus.
In a provider LLM setup that relies on external APIs—OpenAI API, Amazon Bedrock, Anthropic API—focus mainly on measuring token counts, managing 4xx/5xx error rates, and tracking API-layer latency. Above all, validate the content errors that can hide inside otherwise "successful" responses, and continuously optimize response quality by collecting a range of prompt logs.
By contrast, when you build a local LLM on your own infrastructure—using vLLM, Ollama, TGI, and the like—for data security and customization, hardware infrastructure management becomes essential, not just software. You'll need to closely watch GPU memory (vRAM) usage, KV cache utilization (a core inference-engine metric), and per-device GPU utilization in a unified monitoring dashboard to prevent bottlenecks.
Completing End-to-End Visibility with Unified Monitoring
Ultimately, successful LLM application operations in production come down to unified monitoring that connects every flow—from user experience to infrastructure—into a single, continuous line.
RUM (Real User Monitoring) for tracking frontend browser rendering, APM for analyzing backend server transactions, infrastructure monitoring for Kubernetes (K8s) and GPU resources, and dedicated LLM monitoring (LLM Observability) that measures prompt quality and calculates per-token cost—all of these need to come together in one cohesive dashboard.
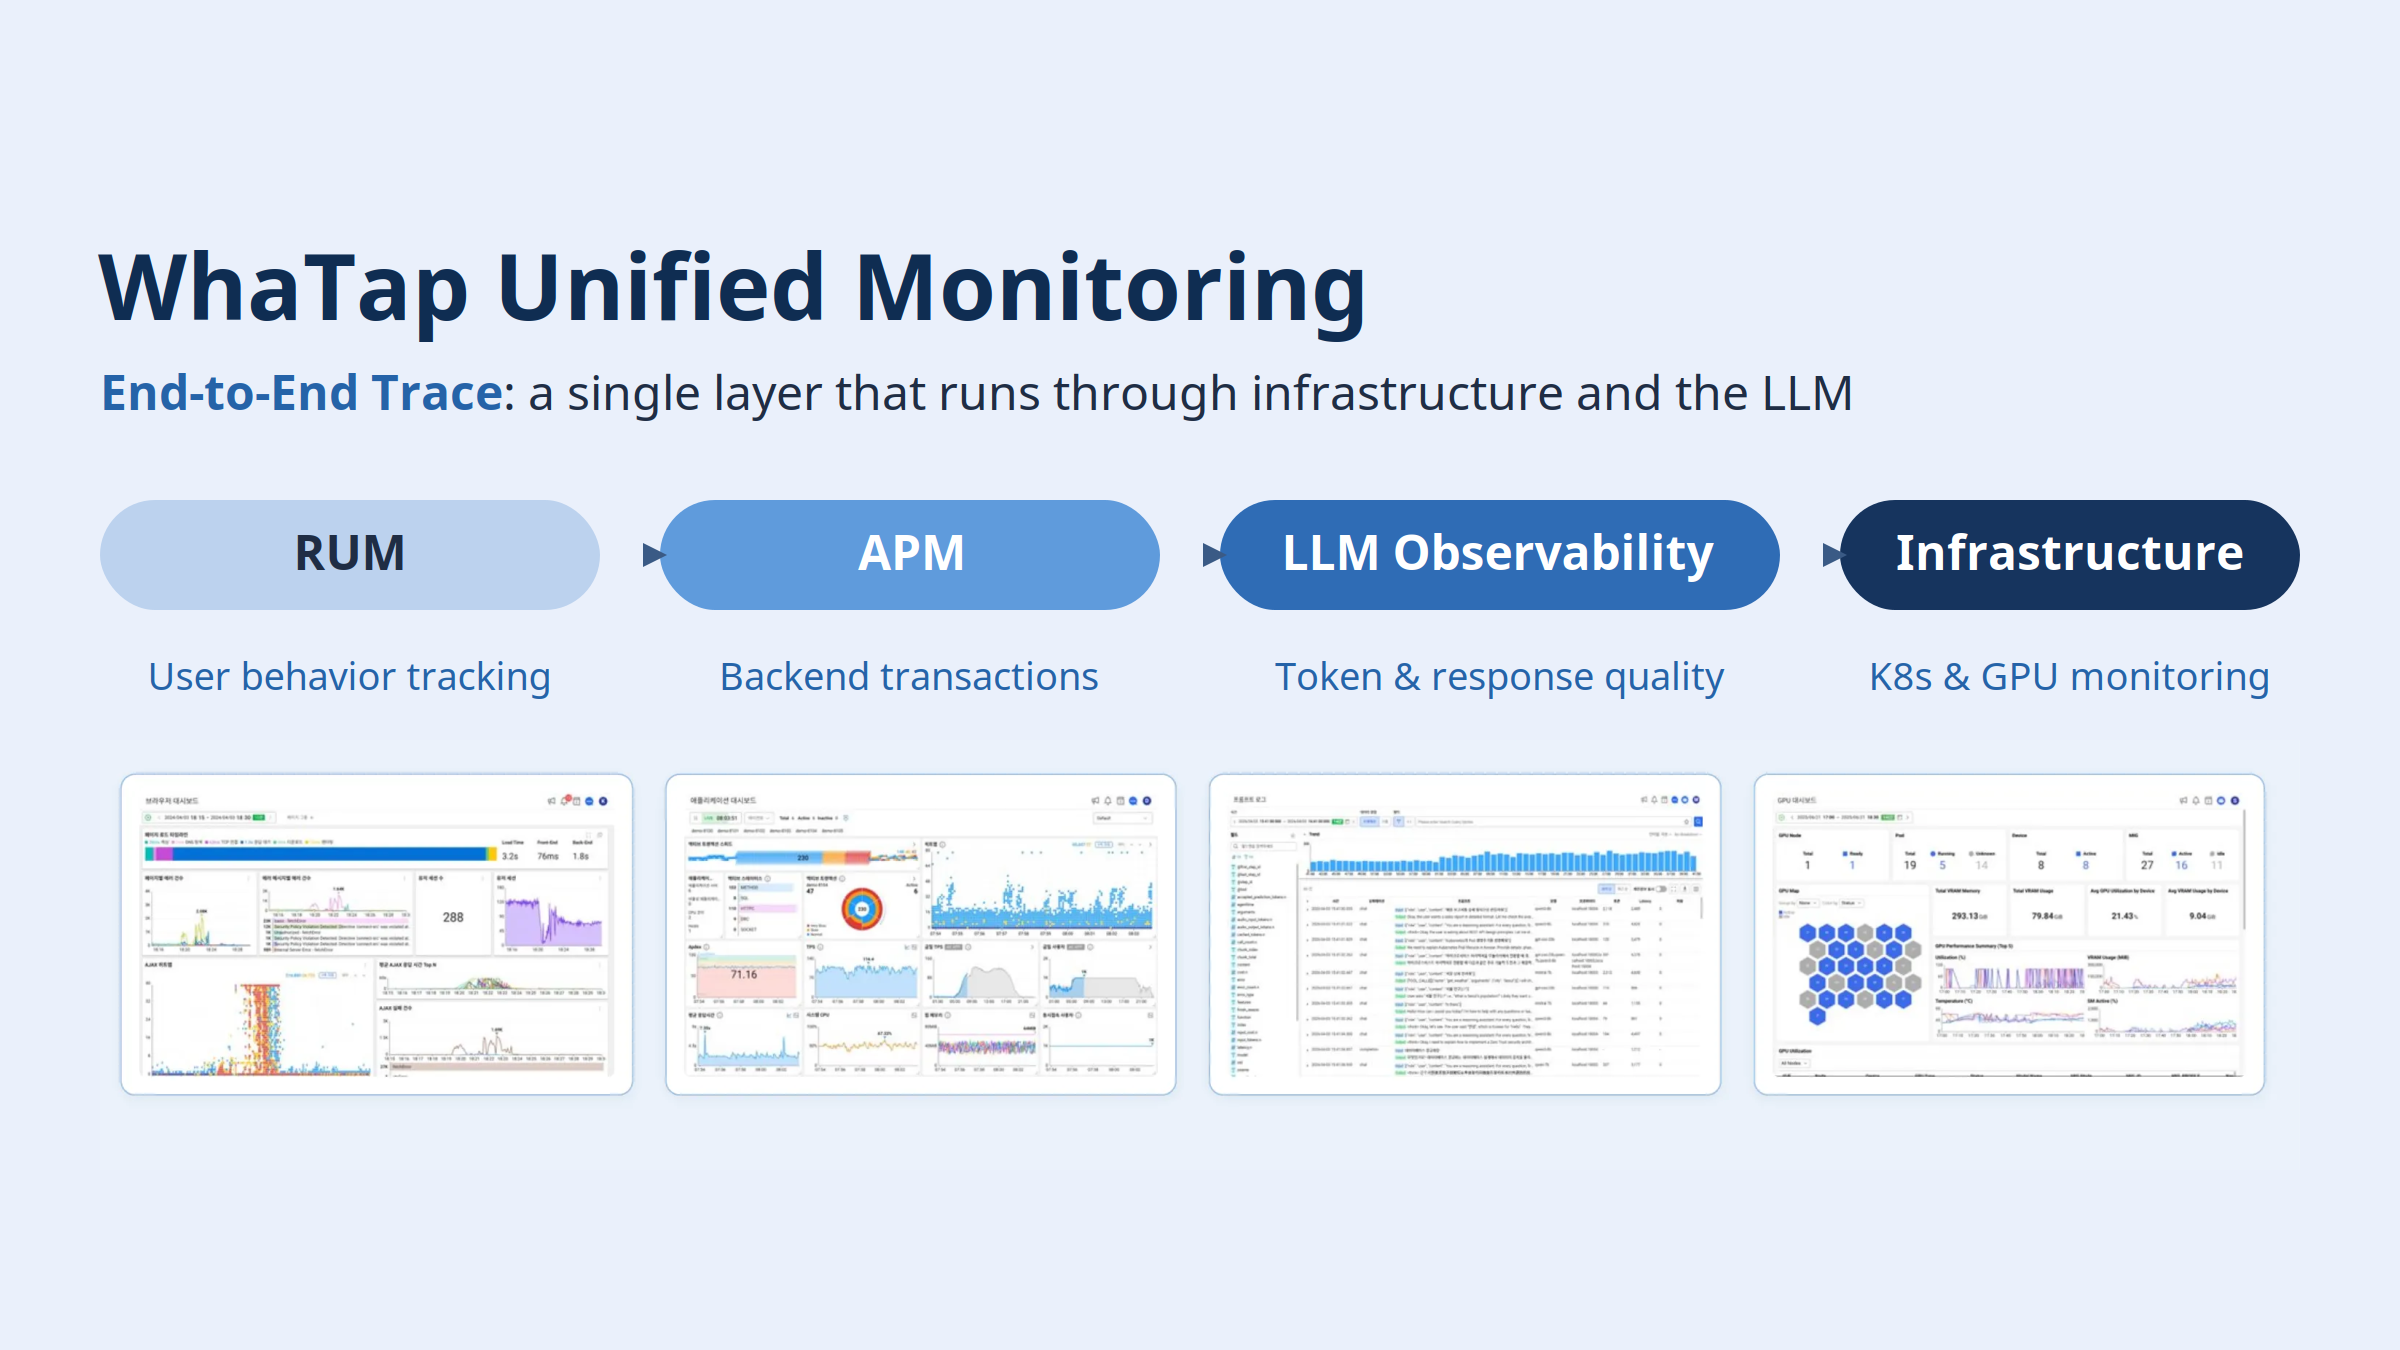
With a unified monitoring tool like WhaTap, you gain traceability that runs straight through your system. That lets you escape hard-to-control costs and the critical risk of hallucination, and deliver more stable and trustworthy enterprise AI services.

💡 LLM Observability FAQ
Q1. Can't I manage LLM applications with my existing Application Performance Monitoring (APM) tool?
A. Conventional approaches alone make it hard to detect the problems unique to LLMs. Traditional APM treats the system as healthy as soon as the server returns a 200 OK status code. But the LLM's actual text output may contain critical hallucinations that are delivering incorrect information to users.
Existing tools can also count transactions (TPS), but they can't tally the number of tokens consumed. So even when transaction counts are unchanged, it's hard to spot situations where longer internal prompts or higher-cost models drive token costs up by 10x or more.
Q2. Which key metrics should I focus on to control LLM performance and cost?
A. In the LLM API layer, it's important to track granular metrics like these:
- TTFT (Time To First Token): the time to first token, as experienced by the user.
- TPOT (Time Per Output Token): the streaming speed at which each token is generated.
- TPS (Tokens Per Second): model throughput per second.
Alongside these, track input and output token usage as clearly separate values, map per-model token pricing, and monitor the cost per call in real time.
Q3. Do monitoring strategies differ between a provider LLM using external APIs and a self-hosted local LLM?
A. Yes. Because the two architectures differ, the areas you need to prioritize differ as well.
In a provider LLM environment—OpenAI API, Amazon Bedrock, Anthropic API—focus on tracking token counts, 4xx/5xx error rates, and API latency, together with validating hallucinations inside "successful" responses and managing prompt quality.
In a local LLM environment running vLLM, Ollama, and similar on your own infrastructure, hardware-layer monitoring is essential on top of the API layer. In particular, you need unified oversight of real vRAM utilization and KV cache usage—a core element of the inference engine—to operate reliably.
.webp)
.webp)