.svg)
%201.svg)

담당자가 프로모션 코드를 발송해 드립니다.
와탭을 경험해 보세요.
와탭을 경험해 보세요.
와탭을 경험해 보세요.
와탭을 경험해 보세요.
와탭을 경험해 보세요.
와탭을 경험해 보세요.
와탭을 경험해 보세요.
와탭을 경험해 보세요.
WhaTap AI를 경험해 보세요.
Comparing AI Inference Optimization Tools: TensorRT vs ONNX Runtime vs Triton
This content was produced in collaboration with an external contributor to bring you real-world expertise and insights from industry professionals.
Do You Really Need GPUs Just to Run an AI Model?
Everyone knows that training AI models requires a ton of GPUs. But here's the thing — you often need GPUs not just for training, but also for actually running the finished model. The process of taking a trained AI model and using it to analyze new data or generate predictions is called inference.
As LLMs and other AI models keep getting larger — and as more teams build multi-agent AI systems that run several models simultaneously — the computational demands keep climbing. At the same time, users expect near-instant responses, so inference has to be fast.
All of this means that GPUs have become essential for running inference in production, especially for high-traffic services where inference requests never stop coming. The GPU bill adds up quickly.
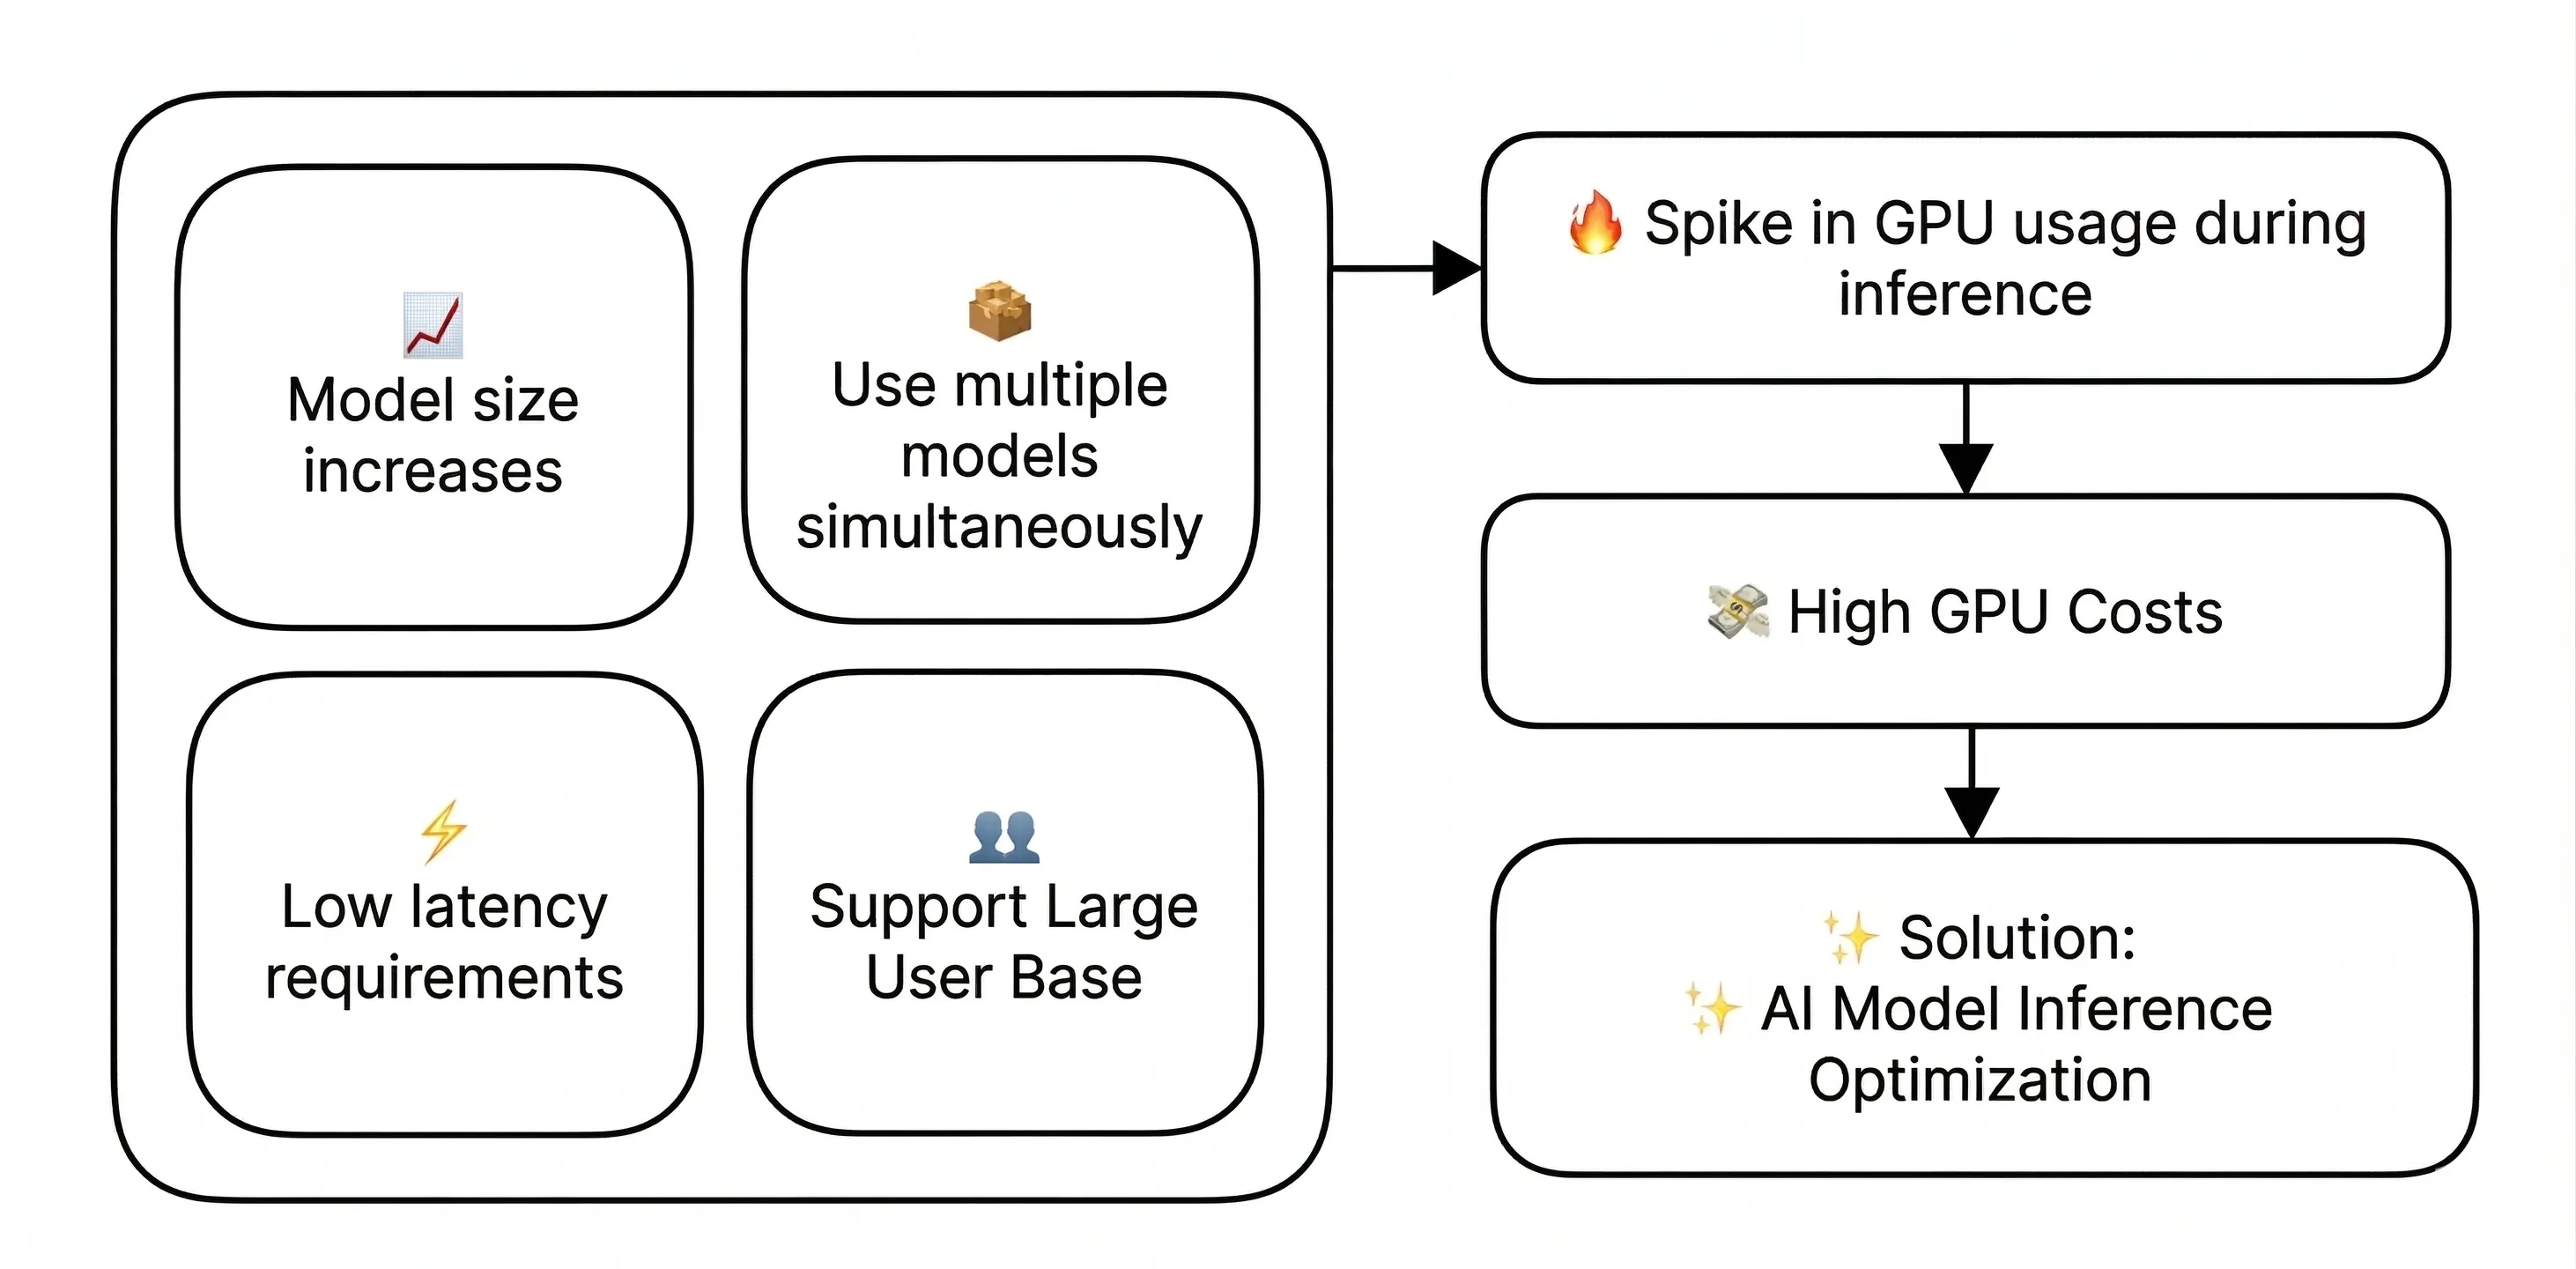
GPUs are expensive and hard to come by. So companies are looking for ways to maintain the same level of performance while using fewer GPU resources. That's where inference optimization comes in.
Inference optimization refers to a set of techniques that make more efficient use of GPU resources without sacrificing model performance. Let's take a look at three major tools that can help.
Three Key Tools for Inference Optimization
The tools we'll compare here are TensorRT, ONNX Runtime, and Triton.
이번 글에서 비교할 툴은 TensorRT, ONNX Runtime, Triton 입니다.
- TensorRT is a high-performance inference engine from NVIDIA, purpose-built to optimize and run deep learning models on NVIDIA GPUs. It delivers best-in-class performance, particularly in single-GPU environments where low latency and high throughput are critical. For more details, check out the TensorRT docs.
- ONNX Runtime is a cross-platform inference engine led by Microsoft. Its standout feature is versatility — it runs ONNX-format models across Windows, Linux, mobile, and even browsers, supporting a wide range of AI frameworks. Beyond GPUs, it works with CPUs, NNAPI, CoreML, and more. See the ONNX Runtime docs for details.
- Triton is a unified model serving platform that can manage and serve multiple models from different frameworks simultaneously. It supports TensorRT and ONNX models (among others) all within a single server. Optimized for Kubernetes and Docker environments, Triton excels when you need to run many models concurrently or handle large-scale traffic. Learn more at the Triton docs.
The table below compares the three tools across several key criteria.
When integrating these tools into a production environment, keep the following in mind:
- Library vs. Server Architecture: TensorRT and ONNX Runtime are libraries you call directly from your application code, while Triton runs as a standalone server that serves models over the network. For smaller projects, the library approach is usually simpler. If you're managing multiple models or need to scale, the server approach is the way to go.
- CI/CD Integration: It's worth embedding your optimization pipeline into an automated CI/CD workflow so model updates can be deployed continuously and reliably.
- Monitoring Strategy: Effective GPU resource management requires real-time monitoring. After rolling out an optimization tool, you need to continuously track key metrics like GPU utilization, memory usage, throughput, and latency. This data is essential for validating whether your optimizations are actually delivering results. You also need real-time visibility into how GPU usage shifts when traffic patterns change or new models are deployed. We'll dig into this more below.
Choosing the Right Tool: A Scenario-Based Guide
1. When you need the fastest possible response times → TensorRT
Think customer-facing chatbots, real-time speech recognition, or autonomous driving systems — any scenario where latency is make-or-break. In one study on traffic signal recognition, TensorRT enabled a vehicle-mounted camera to process traffic lights at 63 frames per second, making safe real-time driving decisions possible.
2. When you need to deploy across multiple platforms → ONNX Runtime
If you want the same AI capabilities on a mobile app, a website, and a backend server — or if different teams are using different frameworks and you want to standardize — ONNX Runtime is your best bet. With support spanning Windows, Linux, iOS, Android, and browsers, it's ideal for cross-platform use cases like translation services. Microsoft itself uses ONNX Runtime across Azure, Office, and Bing, proving its performance and compatibility at scale.
3. When you're running multiple models or handling heavy traffic → Triton
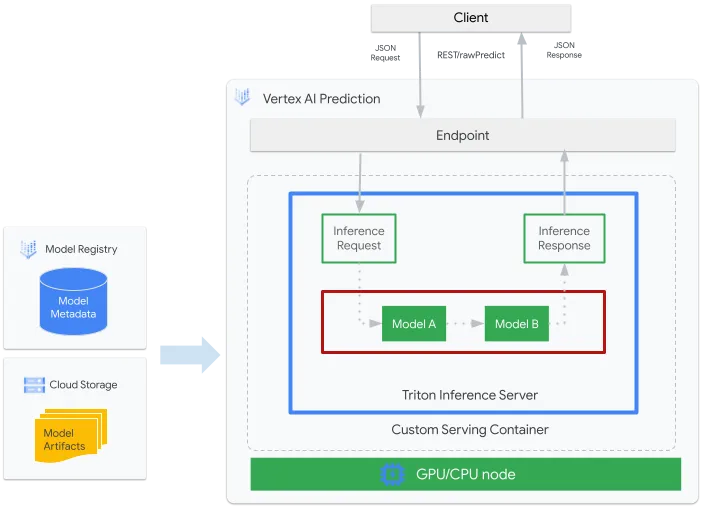
If you're serving thousands or tens of thousands of concurrent users, or if your platform offers multiple AI features — image recognition, text analysis, and more — all at once, Triton is built for that. Major cloud platforms like Google Vertex AI and AWS SageMaker rely on Triton to handle massive volumes of concurrent AI requests.
In short:
- Need the lowest latency and peak performance? → NVIDIA TensorRT
- Need to run models across diverse platforms and environments? → ONNX Runtime
- Need to serve multiple models or handle heavy concurrent traffic? → NVIDIA Triton
How Do You Know If Optimization Is Actually Working?
Deploying an optimization tool isn't the finish line — it's the starting point. To accurately measure the impact and drive continuous improvement, you need systematic GPU monitoring.
To objectively compare performance before and after optimization, you have to be able to measure key metrics: GPU utilization, memory usage, throughput, and latency. For example, when you apply TensorRT, you should be able to quantify exactly how much GPU memory you saved and how much faster your response times got. Without hard numbers, you can't prove the value of your optimization work.
In production, a range of variables — shifting traffic patterns, new model deployments, hardware upgrades — all affect GPU performance. You need to detect these changes in real time and adjust your optimization strategy accordingly. In large-scale environments especially, the ability to quickly identify and resolve GPU bottlenecks can make or break service reliability.
Basic tools like nvidia-smi only get you so far. For the kind of granular, ongoing analysis that production systems demand, you need a dedicated monitoring solution — one that tracks GPU utilization, memory, temperature, and power consumption in real time, with historical analysis and threshold-based alerting. Solutions like WhaTap GPU Monitoring can meet these needs while offering intuitive dashboards that give you a clear picture of GPU health at a glance.
Rather than rolling out optimizations across your entire infrastructure at once, it's safer to start small — test thoroughly in a development environment or a limited project, then expand gradually. At each stage, keep a close eye on GPU performance metrics and carefully evaluate factors like compatibility with existing systems, your team's learning curve, and the added operational complexity.
Wrapping Up
Think of AI inference optimization not as a one-time project, but as an ongoing process: apply the tool → measure the results → identify operational issues → adjust your strategy → repeat.
Optimization tools and GPU monitoring are two sides of the same coin. The optimization tools provide the technical foundation for using GPU resources more efficiently, while monitoring gives you the quantitative feedback to measure impact and guide continuous improvement.
Maintaining the balance between performance and accuracy is equally important. Reducing GPU usage is great, but not if it comes at the cost of model quality or user experience. Real-time monitoring helps you maintain that balance and adapt your optimization strategy as requirements evolve.
I hope the tools and strategies covered here help you build a more efficient GPU infrastructure. As AI technology continues to advance rapidly, here's to building AI systems that are not just powerful, but also cost-effective and sustainable.
.webp)
.webp)

.webp)


